


robin_astro
-
Posts
1,209 -
Joined
-
Last visited
-
Days Won
1
Content Type
Profiles
Forums
Gallery
Events
Blogs
Posts posted by robin_astro
-
-
https://stargazerslounge.com/topic/381251-eruption-of-the-recurrent-nova-rs-oph/
A must see target if you have a Star Analyser (or any spectrograph) Here are my observations from the 2006 outburst. I expect there will be a lot more spectroscopic interest this time round
http://www.threehillsobservatory.co.uk/astro/spectra_24.htm
Cheers
Robin
-
 2
2
-
-
A must see target if you have a Star Analyser (or any spectrograph) Here are my observations from the 2006 outburst
http://www.threehillsobservatory.co.uk/astro/spectra_24.htm
Cheers
Robin
-
Spectra from the last two night with some emission lines identified (The earliest predates the one described in the ATel by 4 hours)
Cheers
Robin

-
2
-
-
small Newtonians are the ideal scope to with the Star Analyser. As my calculator on the RSpec website shows f4 is at the fast end but still just ok for an SA100.
Cheers
Robin
-
1
-
-
A spectrum from last night. We can see from this why the Nova looks so red, particularly in images. By digitally filtering the full spectrum (Blue) by multiplying it by the response of a photometric V filter (Pink) we can see the light that would pass through the V filter (Green). If we measure the area under the green curve and compare it with the area of the H alpha line (between the two dotted lines) we find that there is over twice as much light in just the H alpha line compared with all the light passing through the V filter.
Cheers
Robin
-
5
-
-
9 minutes ago, robin_astro said:
For anyone specifically interested in the details of amateur spectroscopy of Novae and possibly contributing, the ARAS forum have followed several in international collaboration with professionals. Nova Del 2013 was the first major example
http://www.astrosurf.com/aras/novae/Nova2013Del.html
and the current threads monitoring Nova Cas 2021 and Nova Her 2021 can be found here
https://www.spectro-aras.com/forum/viewforum.php?f=36
Cheers
Robin
The BAA also offer a mentoring service for members looking to bring their spectroscopy up to research standard for inclusion in the BAA spectroscopy database
The BAA spectroscopy resources page can be found here
https://britastro.org/node/19378
Robin
-
1
-
 1
1
-
-
1 hour ago, rl said:
Robin, Jeremy, I'm going to do a proper writeup on this with all the details in.
RL
For anyone specifically interested in the details of amateur spectroscopy of Novae and possibly contributing, the ARAS forum have followed several in international collaboration with professionals. Nova Del 2013 was the first major example
http://www.astrosurf.com/aras/novae/Nova2013Del.html
and the current threads monitoring Nova Cas 2021 and Nova Her 2021 can be found here
https://www.spectro-aras.com/forum/viewforum.php?f=36
Cheers
Robin
-
1
-
-
1 hour ago, rl said:
No idea how valid a result this is..did anyone else get a spectrum?
Looks good. Here are spectra by Hugh Allen and David Boyd at around the same time from the BAA spectroscopy database
https://britastro.org/specdb/data_graph.php?obs_id=9977%2C9978&multi=yes&mix_flux=yes
There are two clear broad lines with P Cygni profiles. H alpha with emission at 6563A and another line with emission at ~6350A (Si II ?) both with absorption at about 80A /3700km/s to the blue (P Cygni shape profiles)
The features to the red of H alpha are mainly telluric absorption bands from O2 and H2O in our atmosphere
(Note the dramatic change just 2 days later in my spectrum up the thread)
Cheers
Robin
-
1
-
-
1 hour ago, Pixies said:
Do you mean the absorption 'dip' is obscured by the dominance of the emission line, or that the gas cloud has dispersed significantly enough to reduce its absorption?
Good question but its complicated and above my level of expertise so I will hand you over to Prof Steve Shore who did a running commentary of the evolution of the spectrum of Nova Del 2013 based on amateur spectra
http://www.astrosurf.com/aras/novae/Nova2013Del.html
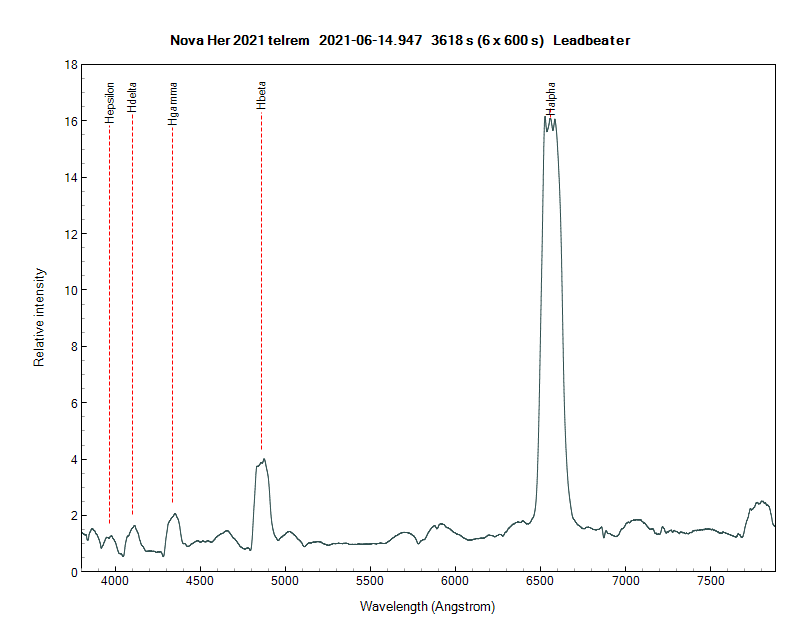
Here is my spectrum from last night with the Hydrogen lines marked (It is not poor resolution. The lines really are that wide !)
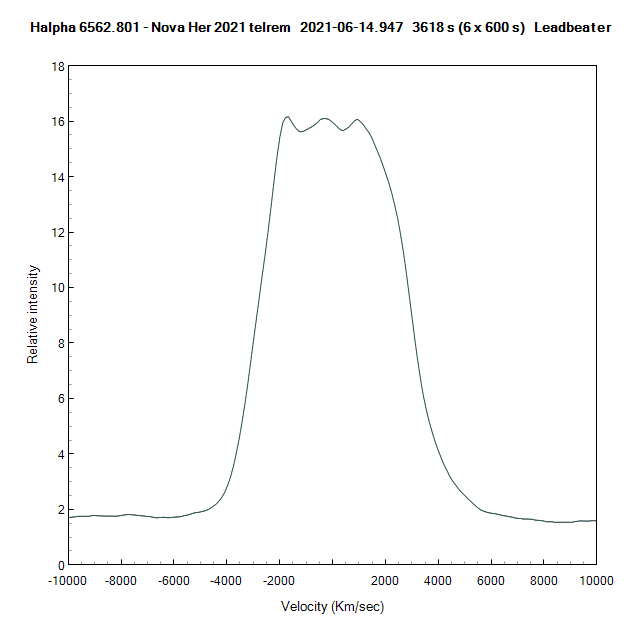
This is the H alpha line profile plotted in velocity space.
The velocities at the edge of the line are ~+-4500 km/s, very high for a Nova (almost Supernova territory, though this is a very different process. In a type Ia supernova the whole white dwarf explodes. Here only a thin shell of material (that has built up on the surface of the white dwarf from the companion star) has detonated. The w shaped wiggles on the top of the line profile contain information about the 3D shape of the explosion. (I think it may mean it was a bipolar shape but don't quote me !)
Cheers
Robin
EDIT: We are seeing the full range of +- velocities in the emission line profiles both towards and away from us now so I guess the ejecta must optically thin (transparent) now
-
5
-
1
-
-
8 hours ago, Malpi12 said:
I think Robin may a have been referring to this spectroscopic bit :-
wiki again : "P Cygni gives its name to a type of spectroscopic feature called a P Cygni profile, where the presence of both absorption and emission in the profile of the same spectral line indicates the existence of a gaseous envelope expanding away from the star."Yep that's right. P Cygni is a Luminous Blue Variable, a hot supergiant star which produces powerful stellar winds which glow in H alpha. Here is an example of its H alpha line by John Foster from the BAA database
https://britastro.org/specdb/data_graph.php?obs_id=6544
This is a similar (though temporary and much more powerful) situation. We see the glow directly from the material thrown out sideways by the explosion which produces an emission line. The material coming directly towards us though is lit from behind so we see an absorption line. This is blue shifted by the doppler effect so we see the combination of an emission line and a blue shifted absorption line - the P Cygni line profile. Here they are in Hugh Allen's spectrum of the nova for example
https://britastro.org/specdb/data_graph.php?obs_id=9977
but in my spectrum last night the emission now completely dominates and we no longer see the P Cygni profiles shape. (I'll post the processed spectrum later)
Cheers
Robin
-
3
-
1
-
-
The spectrum was pretty featureless at first but soon developed P Cygni lines and then quickly moved to just strong broad emission lines. It is very striking looking at it tonight. Here is a 10 min raw spectrum image using the ALPY600. The very bright blob is H alpha
Cheers
Robin
-
4
-
-
These spectra were recorded using my specially modified ALPY200 faint object spectrograph. My spectra are in red overlaid on spectra from the literature in grey.
The main peak is the Lyman alpha line, normally in the UV at 1216 Angstrom but here cosmologically redshifted into the red region of the visible spectrum. (The light travel time is over 12 billion years)
More details on this page on the BAA website
https://britastro.org/observations/observation.php?id=20210411_134753_85f4b3ebf4faaefe
Cheers
Robin
-
7
-
-
Only indirectly on topic for this thread but for a dose scientifically rigorous but distinctly outside the box thinking I periodically dive into exoplanet astronomer Prof Greg Laughlin's fascinating blog
The latest talks about "grabby" civilisations which grab a sphere of influence and how it is all described in Depeche Mode's "Everything Counts"
-
22 hours ago, andrew s said:
Entanglement requires a local interaction to entangle the particles and they would then need to be separated. In addition you would have to stop them interacting with anything else on route to prevent destroying the entanglement
As I understand it, even if you did take one of the pair with you on your intergalactic journey, you could not use it for communication when you arrive as you cannot chose the state when you "open the box"
-
2 hours ago, JRWASTRO said:
I did not even think about it until now. But I will heed to incorporate a model as I will be taking data in a dome (0 to 360 degrees (azi) and 0 to 90 degrees. elevation) . I have a feeling that this might not be straightforward as one will need environmental data.
Hi Jeremy
You can use a model of the atmospheric extinction and depending on the accuracy you are looking it you might find a single set of coefficients (or seasonal ones) good enough
http://astrosurf.com/aras/extinction/calcul.htm
or measure the extinction directly using stellar measurements at different elevations (either the same star as it rises or different stars with known spectra) You do need stable conditions for the period of the measurements though.. You end up with something like this
http://www.astrosurf.com/buil/atmosphere/transmission.htm
Cheers
Robin
-
If you are only interested specifically in the sky brightness in each photometric band though why not measure it directly from images taken through each filter using stars as flux references? (Though you would still need to correct the stellar fluxes for the effects of atmospheric extinction)
Cheers
Robin
-
On 13/03/2021 at 23:16, JRWASTRO said:
Re: how a stars spectra changes with altitude ...
I do not think that this will happen (?) but I would take spectra of the stars above 30 degrees elevation.
The spectrum of a star varies significantly in both intensity and the shape of the spectrum with altitude depending on the air mass, due to atmospheric extinction.
A simple slit spectrograph will give you the data you need (The sky background comes for free with any astronomical spectrum and has to be subtracted to give the spectrum of the target) but you will need some way of absolute calibrating the result. For astronomical objects this is done by measuring a reference star and calibrating against a published spectrum defined as measured at the top of the atmosphere. To measure the sky brightness at the Earth's surface though you would not want to include the atmospheric extinction contribution in your measurement so you would need to separate out the instrument component and just correct for that. Christian Buil's webpage here holds some clues to how this could be done
http://www.astrosurf.com/buil/isis/guide_response/method.htm
Cheers
Robin
-
18 minutes ago, robin_astro said:
systematic errors which are much more insidious and difficult to recognise compared with any effect of slightly lower SNR
A favourite tweet from one of the ASAS-SN team, Though when looking at some of the differences between observers in the variable star databases, I sometimes wonder if it should be an elephant (as in the room)
-
3 hours ago, Xilman said:
As long as you keep all the subs it is straightforward to experiment with what does best in various circumstances. Binning or other forms of smoothing, with or without background removal, can also be helpful on occasion when making quantitative measurements.
The problem with binning/smoothing/stacking is you can reduce the contrast of any outliers making them more difficult to spot. In many (most?) measurements it is the systematic errors which limit accuracy and outliers add systematic errors which are much more insidious and difficult to recognise compared with any effect of slightly lower SNR. (A hot/cold pixel moving in and out of the aperture can look a lot like an eclipsing variable!) Ideally it is better to analyse the subs separately, dealing with any outliers at this stage eg with a sigma clip (or if present in all of them with a bad pixel map)
Cheers
Robin
-
1
-
-
1 hour ago, SteveBz said:
But I totally can't get ISIS to work!
ISIS is very powerful and although it is possible to use ISIS to process Star Analyser spectra, only a masochist would probably use it for this. It is really designed for highly automated rigorous processing of spectra from slit (or fibre fed) spectrographs to produce research quality spectra. For the beginner, programs like Visual Spec and RSpec are much easier to use with the Star Analyser.
-
1
-
-
19 hours ago, SteveBz said:
haven't quite worked out to keep the scale between two spectra so I can just do the zero degrees line.
The dispersion (Angstrom/pixel) will stay the same provided you do not change the distance of the grating from the sensor so you can just use the zero order with the dispersion you calculated from the Balmer lines. (4 Aur is A1v so perfect for this) See video # 24 here to see how to do it in RSpec
https://www.rspec-astro.com/more-videos/
Cheers
Robin
-
1
-
-
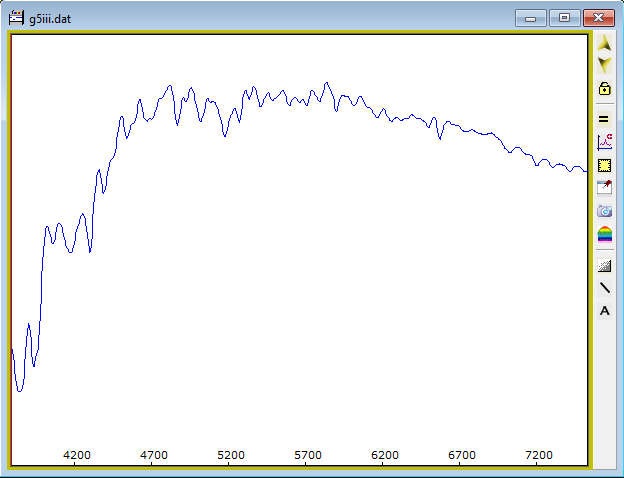
That's much better. (No more of that terrible chromatic aberration) Your identification of the O2 telluric band looks ok so your wavelength calibration should be roughly correct. Capella is a G type star (G3iii) though so the spectrum is mostly a forest of blended metal lines at this resolution and will not show obvious Hydrogen lines. It is best to use a main sequence A star to start with so you can use the clear Balmer lines to focus on and produce an accurate wavelength calibration which can then be transferred to any other target. Capella should look like something like this after correcting for instrument and atmospheric response.
Try overlaying a G star spectrum from the library in RSpec on your spectrum and see if anything lines up. The colour camera will make this more difficult though because of the humps and bumps in the camera response where the filters overlap. (The big dip at ~5700A in your spectrum for example)
Cheers
Robin
-
1
-
-
On 23/02/2021 at 14:41, vlaiv said:
Addition vs average is going to differ only by multiplicative constant. Average / mean is really sum divided by number of samples.
Only provided you preserve the precision in the result. For example averaging a series of 16 x 8 bit images to produce an 8 bit precision result is not the same as summing them and expressing the result to 12 bit precision
-
On 23/02/2021 at 12:54, andrew s said:
Your null result could be due to a change in c with a corresponding change in frequency or length.
Yes the dimensions are assumed to remain constant under rotation but the mean frequency of the photons is based on transitions in a large population of randomly oriented atoms so is not orientation dependent.
These kinds of arguments could equally be applied to almost any observation, even those of flat earthers. 😃. In the absence of evidence, only Ocam's razor can save us from these. Relativity explained anomalous observations. I would argue unless there is evidence to the contrary there is "nothing to see here".
Cheers
Robin


Eruption of the Recurrent Nova RS Oph!
in Observing - Widefield, Special Events and Comets
Posted · Edited by robin_astro
clarification
That tallies with my notes from the 2006 outburst accompanying my Star Analyser spectra which described it as straw coloured a few days after outburst. If it follows the same trend as then it should change to a deep red over the next week or so as the H alpha emission comes to completely dominate the spectrum. Over on CN Keith Geary describes it as blue when he discovered it in outburst, now pale yellow last night and George Wallerstein describes it as purple initially at the outburst in 1958 in this interesting S&T article from 2005 published just before the 2006 outburst
https://skyandtelescope.org/observing/celestial-objects-to-watch/when-will-rs-ophiuchi-next-blow-its-stack/