


robin_astro
-
Posts
1,209 -
Joined
-
Last visited
-
Days Won
1
Content Type
Profiles
Forums
Gallery
Events
Blogs
Posts posted by robin_astro
-
-
4 hours ago, SteveBz said:
sadly, if I do this, I have to decommission my Orion Thin OAG
Most people normally run the Star Analyser without guiding, taking short exposures and stacking them but the distance from grating to sensor is not that critical so this might allow you sufficient leaway to mount the grating before the OAG say and you can still guide on a field star zero order if you want. You can use my calculator hosted on the RSpec website to explore the range.
https://www.rspec-astro.com/calculator/
(Closer gives a more concentrated but lower resolution spectrum for fainter objects while a larger distance gives more resolution up to a point for brighter objects. Avoid going too close and getting warnings but you can increase the distance until you get a warning about problems fitting the spectrum in the field.)
Cheers
Robin
-
20 minutes ago, robin_astro said:
see the faint spectrum of a cool star at the top left of the wide field image which shows molecular bands before it goes way out of focus into a broad fishtail at the IR end

-
 1
1
-
-
Hi Steve,
50mm spacing is a fine starting point for your sensor
There are a few obvious issues
1. Yes you have severe chromatic aberration which is varying the focus along the spectrum and causing the fishtail effect. Fast achromatic refractors are not good for spectroscopy. The Newtonian will be much better.
2. It looks like you have some sort of Bayer pattern in the image. Does your software think it is a colour image ?
3. Your first two spectra may be over exposed. Err on the underexposed side to start with which makes it easier to see and focus on the features in the spectrum. eg see the faint spectrum of a cool star at the top left of the wide field image which shows molecular bands before it goes way out of focus into a broad fishtail at the IR end
Cheers
Robin
-
1
-
-
1 hour ago, Whirlwind said:
However, wavelength and frequency are linked, so a change in the speed of light would change the frequency/wavelength of the light.
Indeed. This is conceptually similar to my suggestion here.
I am still to hear a convincing argument that this cannot demonstrate that the speed of light is isotropic to any given degree of precision. (My tests have already demonstrated this to 10^4)
Robin
-
3 hours ago, Physics_dude said:
Oh nice graph robin_astro! Do you happen to have details on the measurements? Telescope size? Scan time? Pixel array? Wavelength calibration method?
This was with a LHIRES III telescope mounted slit spectrograph at ~0.4A resolution. It is a notoriously unstable instrument so I superimposed precise wavelength markers on the star spectrum with a calibration lamp. I talk about it briefly here at 18:36 min
https://britastro.org/video/13862/14769
Ultimately though slit spectrographs are not so good for precise radial velocity measurement where you are trying to measure the centroids of lines accuracy because the shape of the line can change significantly depending on where exactly you place the star relative to the central line of the slit. Fibre fed spectrographs are better in this respect because the fibre scrambles the profile. (As well as the big advantage of mounting them off the telescope in a temperature controlled environment) These (and the echelle advantages) are the key things that allowed Christian to get about 2 orders of magnitude more precision than here. He is also an extremely skilled observer !
Cheers
Robin
-
1
-
-
6 minutes ago, Physics_dude said:
I just learnt what an echelle spectrograph is
Yep it gives you a double hit. You use all the photons and cross correlation over a wide wavelength range gives you incredible precision (again helped by the choice of star, G/K/M dwarf stars have a lot of lines)
-
1
-
-
I think the current state of the art is the ESPRESSO spectrograph on the VLT which was specified for 10cm/s precision and recently got down to 30cm/s when measuring Proxima Centauri-b and were able to detect activity due to star spots
https://arxiv.org/abs/2005.12114
Robin
-
1
-
-
1 minute ago, Physics_dude said:
His telescope is much smaller than in my calculations and it's a 5.5 magnitude star, that's about 1000x less photons than in my calculations. This'll be a fun exercise to use my new photon statistics math to calculate Christians experimental errors.
For bright targets I suspect you will find the systematic errors are much larger than the photon statistics. In Christian's case he believes they are fibre noise and spectrograph thermal stability. In the professional case ISTR is the stability of the star which makes sub m/s precision difficult
-
1
-
-
16 minutes ago, robin_astro said:
.....and chose your star as the stability of the star puts a lower limit on the measurement.
As an example here are some measurement I made of the variations in the radial velocity of red supergiant Deneb due to non radial pulsations which are several km/s and as far as is known are chaotic in nature, compared with the much more stable main sequence star Vega.

-
1
-
-
On 24/01/2021 at 03:50, Physics_dude said:
My Question: Can we actually measure a stars speed to 1.5 m/s precision. Is there some weird solar effect like flares / rotation / expansion/contraction of atmosphere that would stop us from measuring this accurately?
To ask my question in a slightly different way: I've done a 3D simulation of an observatory on Earth observing Alpha Centauri redshift. Due to the spin and tilted orbit of the earth, we can see fluctuations in the redshift. I've drawn tiny error bars of +/-1.5 m/s (or +/- 0.00003 Angstrom shift) to show the size of the velocimeter measurement error. The error bars are absolutely tiny compared to the the effect produced by the spin of the Earth! Would we actually be able to reproduce the theoretical curve really accurately with an expensive velocimeter?
The answer is yes it is done to this precision by professionals for measuring the wobble due to exoplanets. As you say you do have to make corrections for many factors and chose your star as the stability of the star puts a lower limit on the measurement. (Fortunately In the search for planets capable of supporting life the stars are likely to be stable, like our sun for life to evolve).
You might be interested in this measurement by Christian Buil which describes in detail how it can be done even by an amateur to a 1 sigma precision of 5m/s
http://www.astrosurf.com/buil/exoplanet2/51peg.htm
Cheers
Robin
-
3
-
-
1 minute ago, andrew s said:
1 in 10^4 is good but not conclusive in the esoteric realm of the measurement of fundamental constants 😀 No Nobel prize just yet.😏
Give me a grant and I will build an instrument to improve the precision (The bigger the grant the greater the precision 😀 )
-
 1
1
-
-
3 hours ago, andrew s said:
I think you would need to specify exactly how you would make the measurement for me to comment on if it's doable or not.
Actually I have already done it when testing the stability of my ALPY spectrograph. (To a precision of better than 1 in 10^4)
The spectrograph consists of a lamp filled with excited neon atoms, a transmission diffraction grating and a camera recording the spectrum, all mounted rigidly in a line. I pointed it in a number of different directions including east and west for example. There was no detectable movement in the position of the centroid of spectral lines on the camera sensor as measured from the counts in in each pixel. ie the measured wavelength was constant . For this to be true in an anisotropic c universe either the dimensions of the instrument must depend on the orientation in a complex way (the camera sensor is orthogonal to the light beam) or the mean frequency of the photons (the clock) changed depending on the orientation of the instrument which seems unlikely given the random orientation of the atoms in space.
Cheers
Robin
-
1
-
-
3 hours ago, andrew s said:
It's not unlike using Maxwell's equations
I would say the relationships between wavelength, frequency and velocity and between the wavelength and the diffraction pattern are more universal as it is independent of the physical nature of the wave. (It is effectively just geometry)
-
3 hours ago, andrew s said:
PS On reflection (pun intended) you would need to known the there was no relative motion between the lamp and the receiver to the required accuracy. I can't see how you could do this without using a light interferometer which brings you back to a two way light beam.
It depends on the size of the effect of course but in principle as a thought experiment you could use a rigid stick so the two are guaranteed to be comoving. Perhaps though in a universe where the speed of light is anisotropic the length of the stick depends on the orientation 😉
-
Since the speed of light connects frequency and wavelength and diffraction depends on wavelength shouldn't anisotropic c move the position of the spectral lines from my spectrograph calibration lamp when pointing in different directions?
Robin
-
3 hours ago, SteveBz said:
Oh goodness, I was thinking maybe 700 km/s. Based on 13 A dispersion, but of course I should have used 656 nm for Ha, not 550 nm (green).
The SA200 is very close in cost. Should I go for that?
Remember that you are not measuring a narrow well defined line 1 pixel wide. What you are trying to do with the Star Analyser is compare the distance between two poorly defined fuzzy blobs in the target and reference spectra (The zero order image and the image of the star at H alpha) They will be several pixels wide, dancing about due to the seeing and distorted by the change in focus and the aberrations caused by the converging beam configuration. See the images in the examples I gave above. Measuring this to better than 1% precision is a challenge. With a slit spectrograph the situation is much better as the slit (not the seeing, focus and other aberrations), define the spectral line which is reproduceable so you can measure the position of the (centroid) of the line to a fraction of a pixel. You can measure the wavelength to high precision by comparing with the spectrum of a calibration lamp with well defined lines at known wavelengths.
Go for the SA100, not the SA200. It works better in the converging beam configuration, particularly with fast telescope like your f5 Newtonian (smaller dispersion angle, less field curvature, less chromatic coma.) The SA200 is for if you cannot mount the grating far enough away to get the dispersion you want eg if you have a close coupled filter wheel. See my website for more details
http://www.threehillsobservatory.co.uk/astro/spectroscopy_16.htm
The Star Analyser is not designed for making high precision observations. It is for learning the basics by observing objects with bold features qualitatively to reveal the astrophysics going on before possibly investing in much more expensive equipment. Observations like these I posted near the top of the thread for example
If you experiment with one you will learn first hand the fundamentals of astronomical spectroscopy and understand the issues I am describing much better than me trying to explain them here.
Cheers
Robin
-
1
-
1
-
-
20 minutes ago, robin_astro said:
The recession velocity of NGC7331 (800km/s = 17A at H alpha) is too probably low to measure with a Star Analyser in any case. For high precision measurements you need a slit spectrograph where you have fixed wavelength reference points from a calibration lamp
because of the limitations of accurate wavelength calibration with the slitless Star Analyser I would estimate the smallest doppler shift you could reliably detect with the Star Analyser is probably around 1% or 3000km/s based on the measurements of redshifts I have made using it
Robin
-
1
-
-
2 hours ago, SteveBz said:
So I could measure the recession of a galaxy about 30 million light years away (eg NGC 7331). But NGC 7331 is quite large and probably would need a slit.
The recession velocity of NGC7331 (800km/s = 17A at H alpha) is too probably low to measure with a Star Analyser in any case. For high precision measurements you need a slit spectrograph where you have fixed wavelength reference points from a calibration lamp
For slitless spectrographs like the Star Analyser you need a point source but there are active galaxies (Seyferts, QSO) which appear point like and have high enough redshifts to be measured eg
http://www.threehillsobservatory.co.uk/astro/spectra_3.htm
http://www.threehillsobservatory.co.uk/astro/spectra_21.htm
Instead of the small achromatic refractor I recommend using the C8-N which is the perfect choice for the Star Analyser 100 (and ALPY). You will need a mono astro camera though for faint objects like these. The DSLR will not be sensitive enough. In general colour camera are not a good choice for spectroscopy for many reasons
Cheers
Robin
-
2
-
-
3 minutes ago, robin_astro said:
To get the best out of any slit spectrograph you are going to need a mount which can guide sufficiently well to keep the star on the slit for long exposures
If you start with the Star Analyser though you don't need to guide, just expose for as long as your mount can track for and align and stack multiple exposures
-
1
-
-
10 hours ago, SteveBz said:
My equipment is not flash enough for that. I'd have to upgrade my mount and scope and everything. If I can get interesting information with the Alpy or Dados, that seems like the limit of my travel, at least for the foreseeable future.
To get the best out of any slit spectrograph you are going to need a mount which can guide sufficiently well to keep the star on the slit for long exposures using the spectrograph guide camera. The telescope has to be reasonably well matched to the spectrograph too, for example the ALPY works best at ~f5 but the DADOS and LHIRES need an f10 scope
-
1
-
-
9 hours ago, SteveBz said:
I don't see myself going all out for the LHIRES III
it really depends where your interests lie. The LHIRES III cannot do everything. It is good for high/medium resolution on bright objects but does not work so well at low resolution. The ALPY works better at low resolution and can go much fainter (and the spectra with my even lower resolution modified ALPY 200 are some of of the faintest recorded by an amateur)
Cheers
Robin
-
1
-
-
10 hours ago, SteveBz said:
Do you have a view on measuring rotation curves of galaxies?
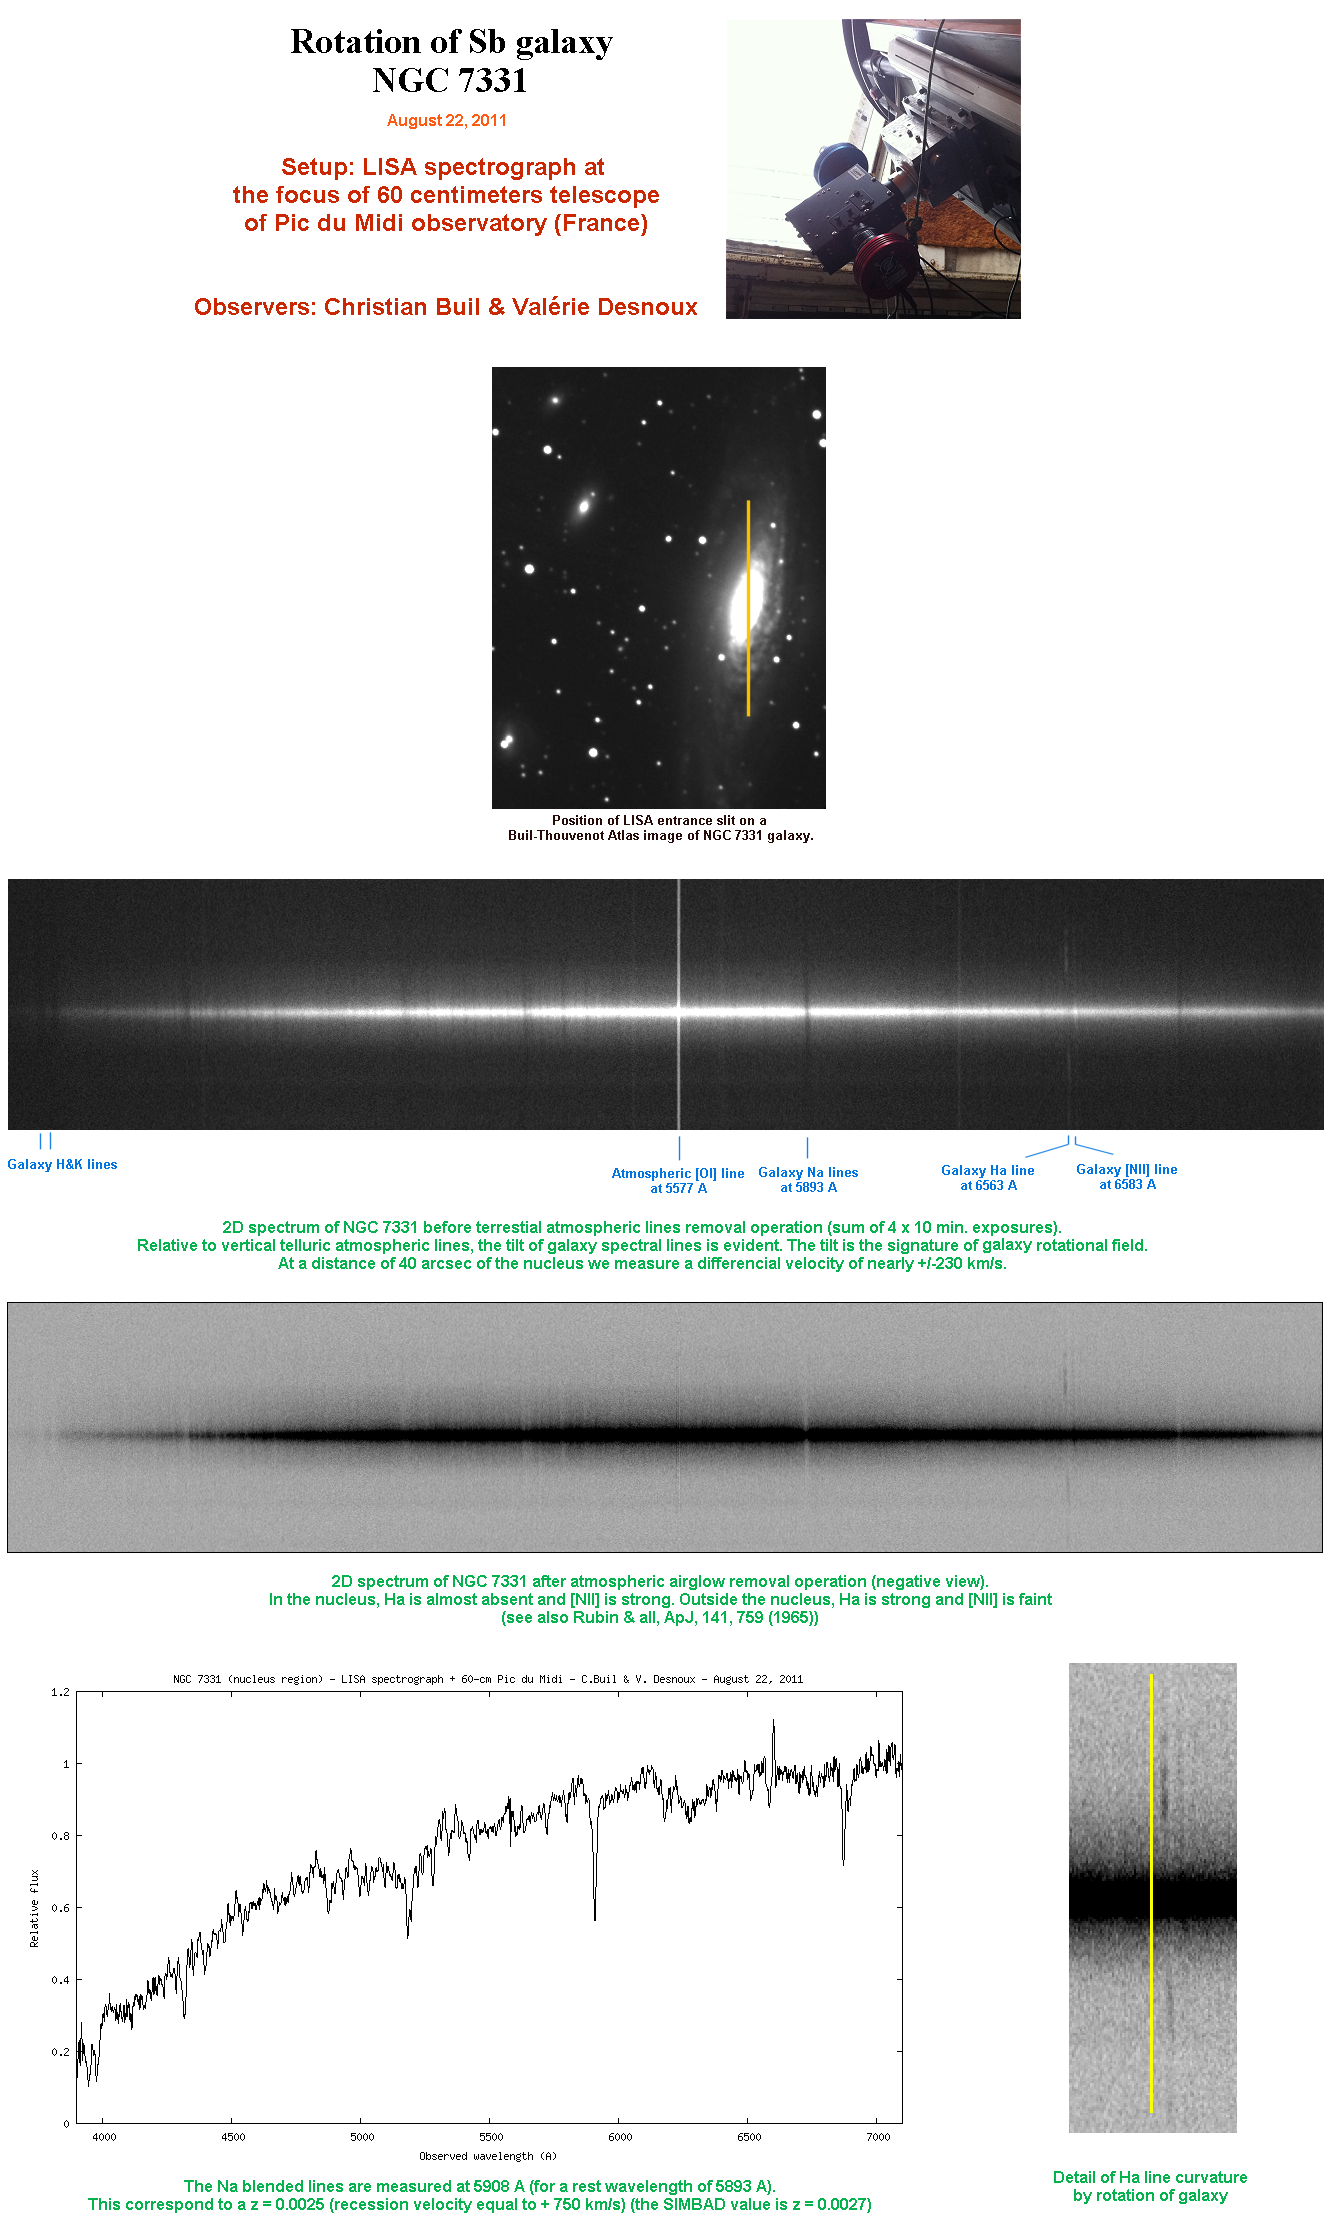
Yes it is possible for amateurs to detect galaxy rotation but unless you have access to a large telescope, only on a few of the brightest galaxies. Some examples
http://www.astrosurf.com/buil/forum/ngc7331_poster.png
http://www.spectro-aras.com/forum/viewtopic.php?f=6&t=1682
http://www.spectro-aras.com/forum/viewtopic.php?f=6&t=2232
http://www.spectro-aras.com/forum/viewtopic.php?f=6&t=2420
http://www.spectro-aras.com/forum/viewtopic.php?f=6&t=2618
Robin
-
1
-
-
5 hours ago, SteveBz said:
relative velocities of ... the stars in globular clusters
This is probably beyond the range of amateur equipment because of the trade off between resolution and limiting magnitude. ie you can either measure high velocities of faint objects like this high redshift QSO with my modified ALPY 200 (resolution ~45A)
or low velocities of bright objects eg the pulsations of Deneb at ~0.3A resolution using a LHIRES III
-
2
-
-
5 hours ago, SteveBz said:
I saw you, Robin, had measured the radial velocity of a comet the other day. How hard was that?
This was done using a LHIRES slit spectrograph at ~0.5A resolution
https://britastro.org/observations/observation.php?id=20200710_225300_18b30a0a785a7ab3
Cheers
Robin
-
1
-


“We don’t really know the speed of light”
in Physics, Space Science and Theories
Posted
True and since my apparatus is made up of solid components the inter-atomic forces which define its dimensions would have to be anisotropic in an anisotropic speed of light universe. This was not the argument put forward in the original article though which claimed that in a relativistic universe it was impossible to measure the speed of light independently in both directions. I claim that my apparatus can do this without needing to resort to a round trip or two observers with "synchronised" clocks.