


robin_astro
-
Posts
1,253 -
Joined
-
Last visited
-
Days Won
1
Content Type
Profiles
Forums
Gallery
Events
Blogs
Posts posted by robin_astro
-
-
42 minutes ago, markse68 said:
what does it mean “Hydrogen alpha emission at velocities up to +-12000km/s ” and what does it infer
Hi Mark,
Most if not all galaxies have a supermassive black hole at their centre and if there is material nearby (dust, gas and even the odd star) it forms a disc and the material heats up as it spirals in producing emission at the Hydrogen alpha wavelength. (these galaxies are termed as having "Active Galactic Nuclei" Quasars and Seyfert Galaxies are examples of these. You can see this effect in this spectrum of M87, the black hole of which was famously imaged a couple of years back.
https://britastro.org/observations/observation.php?id=20190411_213200_531d1ec6d134b3dc
The width of the line (the doppler effect) is a measure of how fast the material near the black hole is orbiting as, if side on, we see the material both coming towards and away from us. (Jets can also be produced coming out from the poles which can have very high velocities) The orbital velocity can be used to estimate the mass of the black hole.
The mass of the black hole is also closely tied to the total mass of the galaxy. In this case the two mass estimates do not agree. There is also some structure in the line ( a combination of different components moving at different velocities. You get a hint of this in my low resolution spectrum but the higher resolution spectra in the paper shows this in more detail)
The authors of the paper interpret this as an indication that there are two black holes in close orbit round each other (There are other examples of this around so we know these exist)
What is interesting in this case is the orbital period has been dropping rapidly (from a year to month) as energy is lost from the system as gravitational waves, suggesting an imminent merger. Note though this is hot off the press and not yet a peer reviewed paper. A merger has never been observed but if it does happen though, watch this space ! As the authors put it
"Copious electromagnetic signals are expected, from radio to X-ray band, binary inspiral
stage to post merger, and from locations such as black hole corona, (possible) jet, accretion disk,
interstellar medium, etc. Neutrino production is also possibly detectable as a result of binary black
hole coalescence. We would like to call the attention of the astronomical community to perform
extensive multi-messenger, multi-band observation on this transient AGN source. Hopefully this
campaign will be celebrated by many unprecedented discoveries in the years to come."-
 1
1
-
 2
2
-
-
According to a paper published last week the 17th magnitude Seyfert Galaxy SDSSJ1430+2303/ (seen here in my spectrograph guider last night)

contains a pair of supermassive black holes who's orbit is rapidly decaying and which are likely to merge in the next 3 years or possibly even sooner in just 100-300 days time. My spectrum (blue, overlaid on the latest spectrum in the paper in grey and corrected for the redshift) shows Hydrogen alpha emission at velocities up to +-12000km/s
More on my BAA page here
https://britastro.org/observations/observation.php?id=20220207_205606_9d5b2259183a3d41
Cheers
Robin
-
13
-
-
The paper linked from that page has the dimensions for 611 Mhz and construction details (appendix 4)
-
1 hour ago, Jjmorris90 said:
How can I get rid of the dust?
The flat is there to deal with them but if you want to track them down you can work out which surface they are on from the size using eg a calculator like this
https://astronomy.tools/calculators/dust_reflection_calculator
Cheers
Robin
-
18 hours ago, SteveBz said:
Is this anywhere near the right calibration and response correction (not divided by 29 Ari)?
The wavelength calibration looks about right but something has gone wrong with the response correction. I recorded a Uranus spectrum with the the ALPY 600 a couple of weeks back. It is in the BAA database. This is what the response corrected spectrum looked like
https://britastro.org/specdb/data_graph.php?obs_id=11449
and this is what it looks like after division by the Pickles G2v spectrum, compared with the measurement from a professional paper
-
1
-
-
On 18/01/2022 at 14:14, SteveBz said:
My first question is, I don't even know where the H-Beta line is, if there is one
There are no Balmer lines in the reflectance spectrum (Uranus is not hot enough to produce these) There will be Balmer lines from the reflected sunlight but they are not obvious in G2v spectra at low resolution. If you don't know the dispersion of your setup (eg from past measurements of hot stars), you will have to guess the dispersion, either matching the features in the spectrum of 29Ari to the G0v template or you could use the Telluric bands in 29Ari (They are probably too mixed with the broad methane bands to be used in the Uranus spectrum)
Cheers
Robin
-
1
-
-
On 18/01/2022 at 14:14, SteveBz said:
What to do next? I'll work on the 29 Ari file in the meantime, but could I not use a standard library spectrum?
Nice Methane bands !
You can divide by a library G2v spectrum to produce the reflectance spectrum but would need to response correct the Uranus spectrum first.
Cheers
Robin
-
1
-
-
4 hours ago, SteveBz said:
sadly I don't think I can get that low.
It culminates ~19:00UT at ~50 deg altitude from here in the north of England at the moment so should be a few degrees higher for you.
https://airmass.org/chart/obsid:wright/date:2022-01-11/sso:p%3AUranus
The problem could be the moon though at the moment which is very close tonight, only 4 deg away, moving away but getting fuller over the next few nights.
Cheers
Robin
-
1
-
-
WD 1856b is a Jupiter sized exoplanet in a close orbit around a much smaller white dwarf star, transiting every 1.4 days. (An interesting conundrum is how it managed to avoid being engulfed during the parent star's red giant phase). Actually, partially eclipses is perhaps a more apt description as it is a 56% deep grazing event and so is on the observing list for the JWST to measure the spectrum of the starlight passing through the planet's atmosphere. Although much deeper than typical exoplanet transits, measuring it did present some interesting different challenges due to its faintness (mag 17) and brevity (8 min). Here is an image of the star in question and my transit measurement. For anyone interested in following up the discovery of this unusual exoplanet and the planned JWST measurements. I have put some more information up on my BAA page
https://britastro.org/observations/observation.php?id=20220106_172719_c34e10f42c4fc746
Cheers
Robin
-
12
-
-
11 hours ago, SteveBz said:
Does anyone have some nice ideas for spectroscopy in the current season
Have you bagged a Uranus spectrum yet? Well placed in the early evening, about the same brightness as 63 And. It should appear pretty much star like in your short focal length Newt so give a sharp spectrum showing nice Methane bands. G0v star 29 Ari is conveniently nearby too at the moment and similar enough to the G2v solar spectrum so if you take that as well and divide one by the other (no need to correct for response) you should get the reflectance spectrum of Uranus direct without the contamination from the solar spectrum features.
Cheers
Robin
-
1
-
-
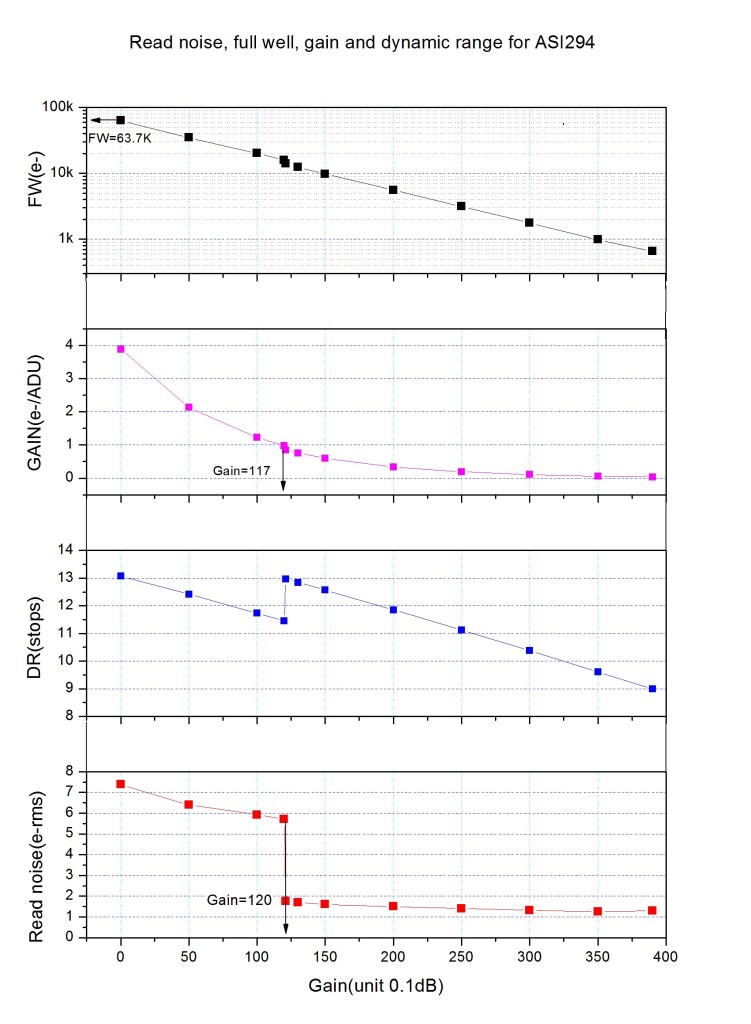
You also need to watch what gain you run with some of these CMOS cameras if you are stacking a lot of short subs. You can generally get away with more shorter subs with CMOS compared with CCD as the read noise is lower but if you look at the specs for this camera the read noise suddenly shoots up to a poor figure at lower gain settings
https://www.firstlightoptics.com/user/products/large/zwo_asi294mc_read_noise.jpg
Robin
-
A quick search suggests naturally produced atmospheric I2 may impact ozone levels though eg
https://www.pnas.org/content/114/38/10053
Robin
-
1
-
-
16 hours ago, saac said:
It must be standard procedure to subtract an atmospheric background reading when processing any stellar spectrograph surely.
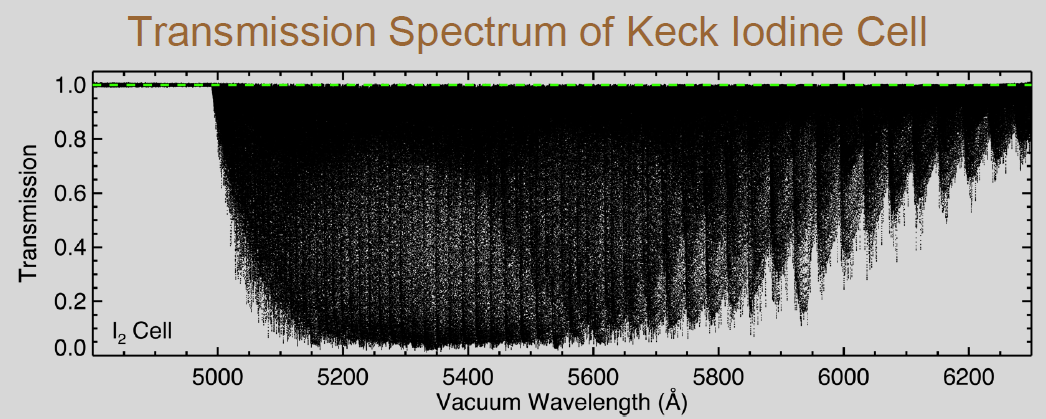
Correct. Spectra of so called telluric standard stars are recorded to correct spectra of the target for atmospheric absorption. (Absorption lines from the interstellar medium are also imprinted on spectra) You probably would not want to be observing directly through a cloud of Iodine though. Molecular Iodine has a lot of lines in the visible spectrum, so much so that Iodine cells are used to calibrate high resolution spectrographs. You might have difficulty "seeing the wood for the trees" !
http://spiff.rit.edu/classes/resceu/lectures/radial_vel/iodine_spec.png
Cheers
Robin
-
1
-
1
-
-
The reference given at the foot of the article appears to an unrelated paper. Here is the original paper
https://www.nature.com/articles/s41467-021-26920-6
-
19 hours ago, sirenity said:
naked eye quite red and twinkling like a mad thing
Arcturus perhaps ? Bright, orange almost directly West (rather than SW for Ophiuchus) after dark currently. Low in the sky so twinkling due to the thickness of atmosphere we are looking through
Cheers
Robin
-
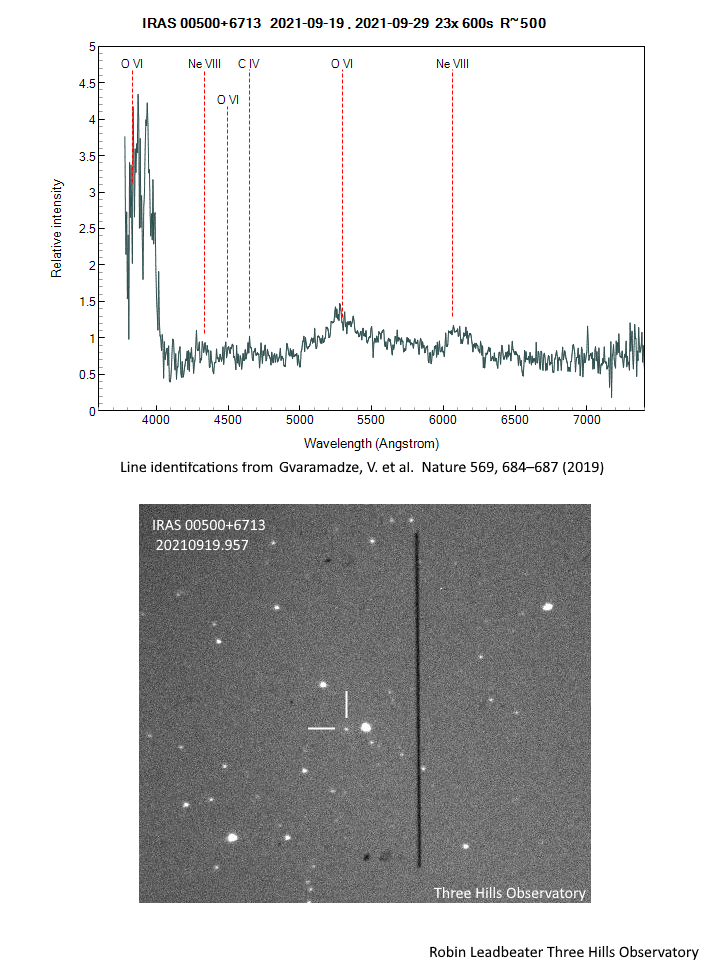
This spectrum (taken using the C11 and ALPY600 spectrograph) is of magnitude 15 star IRAS 00500+6713 in Cassiopeia. It is believed to be the result of a merger between two white dwarfs, kept from complete collapse by a powerful magnetic field and may be the stellar remnant of the supernova seen by Chinese astronomers in 1181. It is a star of extremes with a temperature of 200,000 K and 16,000 km/s winds. More about this star and references on my BAA page here
https://britastro.org/observations/observation.php?id=20210930_153458_144e8bbb0f30f495
Cheers
Robin
-
7
-
-
Nice capture but note that AT objects are not necessarily supernovae (in fact most probably are not). To be confirmed as a supernova it needs to have spectrum taken. In this case it turns out to be a Cataclysmic Variable (a dwarf nova) in outburst in our own galaxy. You can see the classification on the Transient Name Server (where AT numbers are generated and where, if they do turn out to be supernovae, the name is changed to SN yyyyabc , the point at which it officially becomes a supernova
https://www.wis-tns.org/object/2021yaf
Cheers
Robin
-
2
-
1
-
-
13 hours ago, Merlin66 said:
2. The movements in the solar surface are clearly seen as "wiggles" in all the absorption lines.
The same wiggles are also seen in the Telluric H2O lines from our own atmosphere so cannot be solar in origin. See the comparison with a high resolution annotated professional spectrum
Cheers
Robin
-
Hi Ken,
What's causing emission peaks round the sharp absorption lines ? Is this some sort of sharpening/compression artifact?
Or a diffraction effect off the edge of a very narrow slit perhaps?
Robin
-
Some school lab diffraction gratings are not too bad. The Star Analyser started out as one of those. (All gratings you can buy are replicas from a master, that has nothing to do with the quality)
The simplest thing you can try is put it in front of a DSLR camera and image some stars with it. It will turn the stars into smeared out spectra. Like this on my website using a Star Analyser but use a shorter focal length lens with your grating perhaps around 20-30mm otherwise the spectrum will be too long and faint. (test it by pointing at a bright street light first before trying on stars)
http://www.threehillsobservatory.co.uk/astro/spectroscopy_11.htm
http://www.threehillsobservatory.co.uk/astro/spectroscopy_17.htm
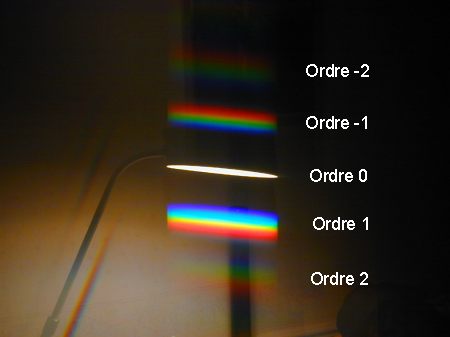
It will work on the brightest stars but how well it works on fainter stars though will depend on the efficiency of the grating. If you look through it by eye at a point light source, you will see some light which goes straight through and several spectra either side of that. If it is a good grating one spectrum will be brighter than the others. Something like this on Christian Buil's website.
http://www.astrosurf.com/buil/us/stage/session0/img2.jpg
All the other light except in that spectrum is wasted light so the more light is in one of the spectra the better
If you want to try something more sophisticated to mount on a telescope here is a simple design also from Christian Buil which would work with your 600 l/mm transmission grating. Use it without the slit so it is simple to use as you don't have the problem of putting the star on the slit and guiding it there.
http://www.astrosurf.com/buil/us/loris/loris.htm
Here it uses a 300 l/mm grating. For 600l/mm you would need to double the angle.
Cheers
Robin
-
1
-
-
Steve,
If you want to see a binary in action in "real time" with the Star Analyser an eclipsing binary like U Cep is a good target. Here by Mike Harlow with an objective prism but the Star Analyser should also show the changes in the spectrum well
https://britastro.org/node/19199
Cheers
Robin
-
2
-
-
18 hours ago, SteveBz said:
Do you think I could improve the spectrum I got, or is that pretty much as good as it gets with the SA? I was pretty sure you had some better resolved ones.
Careful focusing on the specific region of interest and choosing targets at high elevation and nights with better seeing can help but I think that is pretty typical for the Star Analyser used in the conventional way. I use other spectrographs for high resolution work. There are examples using the Star Analyser with combinations of wedge prisms at very high dispersions to get high resolution but these are either objective grating setups (ie mounted in front of the telescope/camera lens) or are high focal ratio setups which reduce the aberrations that the converging beam produces. but these are tricky to use and calibrate compared with the standard Star Analyser setup or conventional slit spectrographs. See the experiments by Uwe Zurmuhl for example in "Spektrum" editions 51 and 55
https://spektroskopie.vdsastro.de/journal-30.html
Resolution is not the only parameter in spectroscopy. You can go much fainter at low resolution and there are lots of interesting targets for the simple Star Analyser including WR stars, bright novae and supernovae and even quasars.
I would say attempting to see the difference between two almost identical spectral types (6,7 Lyr) which will only show the subtlest of differences is not the best place to start though. Perhaps try Albireo instead. The hotter star A8v star would make a good calibration standard and is interesting as it is also a Be star. (Can you detect any H alpha emission line?) and the cooler K2ii star will have strong metal lines so would be a good test of how much you can resolve the features)
Cheers
Robin
-
1
-
-
6 Lyr is also one of the stars in the MILES catalogue of stars (referenced on my web page on flux calibration.) Here it is in the database included with ISIS software.
-
1
-
-
7 hours ago, SteveBz said:
It may be that 6 Lyr also has a further close companion a few AU from it that don't appear in Gaia and that is what is showing in the 6Lyr spectrum.
Yes 6Lyr definitely is a known binary with a close secondary (The orbital period is just 4.3 days) but the secondary is not seen in the spectrum, most likely because it is much fainter. We know it is a binary because the lines in the spectrum from the primary move back and forth on a 4.3 day period. This is known as a single line spectroscopic binary. See the wikipedia page for the reference to the 1910 paper
Cheers
Robin
-
1
-


WD1856b - A white dwarf exoplanet and JWST target
in Imaging - Planetary
Posted · Edited by robin_astro
clarification
I got the idea to observe it after watching a video about this being a proposed target for JWST (link on my BAA page). The equipment I used is described on the BAA page. I just took a series of 1 minute exposures and measured the brightness in each one, relative to a non variable star in the same field (a standard technique for measuring variable stars) .The points in the graph are a 3 point moving average to smooth out the noise a bit. The transit time was from the NASA exoplanet archive website, also linked from the BAA page. This is very different from the usual exoplanet transits where the brightness just drops by a percent or two. Here it drops by half, but is it also much shorter compared with typical transits which can last for a couple of hours and a rather faint target (white dwarfs are not very luminous because they are so small) The diagram at the top of the graph shows the configuration inferred from the brightness drop but of course we cannot see that from here