


robin_astro
-
Posts
1,253 -
Joined
-
Last visited
-
Days Won
1
Content Type
Profiles
Forums
Gallery
Events
Blogs
Posts posted by robin_astro
-
-
A spectrum of SN 2021K from last night gives a good match to a type Ia near maximum (The characteristic broad Si II absorption is now clear at ~6200A)

Cheers
Robin
-
 3
3
-
-
41 minutes ago, SteveBz said:
me trying to take a spectrum of Alpha-Cas through a layer of frost with a diffraction grating!
K spectral class stars like alpha Cas are not the best choice for a first try as the spectrum has a myriad of faint fine lines which are unresolved resolved at low resolution. Delta Cas would be better as it is a main sequence A star with clear Hydrogen Balmer absorption lines, or if your camera has sufficient sensitivity at H alpha, Gamma Cas which is a Be star so shows He alpha in emission. See here for examples of both using an early prototype of the Star Analyser (In Patrick Moore's back garden!)
http://www.threehillsobservatory.co.uk/astro/spectra_12.htm
Cheers
Robin
-
On 02/01/2021 at 22:52, robin_astro said:
My spectrum from last night is inconclusive so I cannot officially classify it. I suspect it may be a type Ia
Unfortunately the weather prevented me from getting another shot at this and it has now been classified (unusually from a spectrum at the UV/blue end of the spectrum). My suspicion that it was a type Ia turned out to be correct though
-
I still like to use the Star Analyser from time to time, though mainly for fun rather than for Pro-Am science. See here for an example
and see here on my BAA personal page for more examples of spectra taken by all three instruments
https://britastro.org/observations/user.php?user=146
Cheers
Robin
-
2
-
-
Hi Steve,
I developed the Star Analyser in 2004 and convinced Paton Hawksley to manufacture it after experimenting with similar setups as the one you are trying. It is a great simple low cost way to try spectroscopy and you can discover a lot about how to do spectroscopy and what it can tell you before spending too much money. (There are at the last count around 6000 of them worldwide). If you are interested you can listen to me talk about the development of the Star Analyser (and how I modified my ALPY to measure some of the faintest objects ever recorded by an amateur) in this BAA talk.
https://britastro.org/video/11250/12234
You will also find more useful information on the BAA spectroscopy resources page
https://britastro.org/node/19378
The other goto website for everything about spectroscopy for amateurs is Christian Buil's
http://www.astrosurf.com/buil/index.html
I would not say most of my spectra are taken with the ALPY. (I do not put most of my spectra on my website these days. ) I use them both fairly equally. (eg the LHIRES on bright objects at high resolution on moonlit nights and the ALPY on faint objects at low resolution on dark nights) You can see my current spectra (400 of them of 203 different targets currently) under R Leadbeater in the BAA database. (click the all headers button to see what equipment was used)
I bought the LHIRES as a kit when it first came out in 2006 and I was a beta tester for the ALPY when it came out in 2013. The LHIRES and ALPY are quite different instruments which fulfil different functions so they complement each other. With spectroscopy the more you spread the light out the fainter the spectrum so you can either measure bright objects at high resolution or faint objects at low resolution. (High and low resolution spectra tell you different things about the astrophysics) The LHIRES is optimised for the former while the ALPY is a low resolution instrument which can measure much fainter objects. The ALPY is a more straightforward next step from the Star Analyser and easier to use than the LHIRES with no adjustments once it is set up, though the processing is somewhat more complex.
Cheers
Robin
-
2
-
-
There are alternative solutions to calibration so you can get away without the ALPY calibration module, to begin with at least. Baader do not supply one for the DADOS (well a crude neon lamp which is not sufficient) I would definitely not buy an ALPY (or any spectrograph) without a guider module though. There is no simple answer to which spectrograph is best though. It depends on what you want to do with it. Each can do things another cannot. I have yet to see any serious results from the SX spectrograph.
Cheers
Robin
-
2
-
-
19 minutes ago, SteveBz said:
So I imagined I could guide my main scope which has an OAG and that would have the same effect. Essentially my Celestron Newtonian 8" would become the guidescope.
S
Slit spectrographs are very difficult to use except on a few bright targets without a built in (mirror slit) guider The mirror slit guider in a slit spectrograph does more than just keep the star on the slit.
First it allows you to see the spectrograph slit and the surrounding field so you can actually place the star on the slit (which is typically only ~20 microns wide) Without this, until the star lands on the slit you see nothing in the spectrograph so you are completely blind
It then allows you to focus the star on the slit so you get the maximum amount of light into the spectrograph
Finally it allows you to keep the star on the slit in long exposures which might be an hour or more in total on faint on objects without any issues like flexure or field rotation etc
I would say in the past this was one of the most overlooked item in amateur spectroscopy resulting in amateur built spectrographs collecting dust in cupboards. The introduction of the mirror slit guider into spectrographs for the amateur was, along with the CCD camera probably the most significant development contributing to the advancement of amateur spectroscopy
Cheers
Robin
-
1
-
-
1 minute ago, SteveBz said:
If I buy the SA100 plus the prism, will the prism correct the focus? That's what I was hoping.
S.
The prism gives only a marginal improvement for an SA100, more for an SA200 but brings its own issues (eg non liner calibration) and most users don't use one. It reduces the aberrations a bit giving a sharper spectrum and less change along the spectrum but the focus in the spectrum is still different compared with the zero order. Generally you can see the best focus by eye, helped perhaps by deliberately trailing the spectrum. See Christian Buil's pages for example for tips on how to get best results from the Star Analyser.
http://www.astrosurf.com/buil/staranalyser/obs.htm
http://www.astrosurf.com/buil/staranalyser3/userguide.htm
At the end of the day though these simple setups are about good fun to learn on without spending too much before moving on to a "proper" spectrograph of good design either commercial like the ALPY or a good home build design like the lowspec. (It is easy to design a spectrograph on paper but there are lots of important subtleties and to produce one that actually works well in practise is much more difficult)
Cheers
Robin
-
1
-
-
the simple SA configuration varies in focus because of the angle of dispersion which means the distance from grating to sensor varies. The Alpy in focus along the spectrum because of the optics. My junk box design is also in focus within the limits of the camera lens performance. (field flatness, chromatic aberration)
Cheers
Robin
-
1
-
-
2 minutes ago, SteveBz said:
Hi Again,
Actually, I wanted to ask, why did you not go the whole hog and devise a set of components, like optional slit, optional collimator, optional focus lens, all in the same Star Analyser format, that you could just buy and screw together?
Regards
S.
The design there was just a bit of fun to demonstrate how spectrographs work It would not be commercially viable for Paton Hawklsely who are a grating manufacturer and the performance would not be as good as an alpy which is purpose designed with special opticsso they supply shelyak with gratings and let them make spectrographs . To be practical, slit spectrographs also need a guider which significantly adds to thew complexity
Cheers
Robin
-
1
-
-
If you have the zero order in the same field you can focus on that, then bring the spectrum to best focus either by eye or use a real time spectrum display tool like RSpec looking for the deepest lines. If you then note how much you have to move the focuser you can reproduce this on other targets. (Note the focus will vary along the spectrum, particularly with your achromatic refractor so it will be a compromise
Cheers
Robin
-
1
-
-
Hi Steve,
To focus you chose a target with nice strong features and focus on these in the spectrum, not on the zero order. I suspect though you will have difficulties getting a sharp spectrum with this high dispersion grating and thick prism because the beam is converging through the grating and prism giving severe aberrations. (The Star Analyser deliberately uses a low dispersion grating to minimise this problem) You could adapt it to a parallel beam though using an afocal type setup, similar to this I developed using an SA200 (a sort of poor mans ALPY)
http://www.threehillsobservatory.co.uk/astro/spectroscopy_19.htm
Cheers
Robin
-
1
-
-
And finally...
A brand new one to kick off the new year. AT2021K discovered yesterday at mag 15.7 in galaxy MCG +06-30-084
https://www.wis-tns.org/object/2021k
"AT" signifies it has not yet been confirmed and classified as a supernova. It is another who's light dominates its parent galaxy as seen in the discovery image
https://alerce.online/object/ZTF21aaabvjk
My spectrum from last night is inconclusive so I cannot officially classify it. I suspect it may be a type Ia , (the thermonuclear detonation of a white dwarf in a binary system) though the usual identifying feature (Si II absorption at around 6300A) is not obvious
Cheers
Robin
-
3
-
-
Here's another one from last night. SN 2020adow discovered a week ago in a relatively nearby galaxy KUG 0830+278 (redshift 0.0075)
https://www.wis-tns.org/object/2020adow
Here overlaid on matching type Ic supernova SN1994I, and below compared with the professional spectrum used to classify it
Type Ic are a relatively less common type of so called "Stripped Envelope" Core Collapse Supernova where the exploding massive star has already lost its Hydrogen and Helium so these do not appear in the spectrum. The narrow line at H alpha (at 6612A, red-shifted from 6563A) is from the host galaxy which is completely outshone by the exceptionally powerful supernova, here identified as a broad lined (BL) variant due to the higher than usual velocity of the explosion. The magnitude here was ~14.5. Note how my spectrum appears to be redshifted relative to the professional spectrum taken a few days earlier. This is because we are now seeing slower moving material in the spectrum (less blue shifted) compared with a few days earlier.
Cheers
Robin
-
3
-
-
An example of how tolerant spectroscopy can be of bright sky conditions. This supernova SN 2020uxz has now faded to mag 16.5. Despite the sky background being around 5x brighter than the spectrum (Taken using an ALPY modified for faint objects at lower resolution) there is still enough signal to identify it as a type Ia around 70 days past maximum, matching for example SN 2002bo from SNID (red) at a similar age.
Cheers
Robin
-
8
-
-
17 hours ago, Ed astro said:
pointing the antenna to the ground.
Doesn't this give a strong thermal signal? It does at 12 GHz
http://www.threehillsobservatory.co.uk/astro/radio_astronomy/radio_astronomy_1.htm
or is it insignificant compared with galactic hydrogen ?
Cheers
Robin
-
15 hours ago, Carl Reade said:
Another way would be to feed the system with a dummy load instead of the antenna for a period of time while recording. Straight into the LNA then reconnect the antenna feed.
Carl
A "Dicke switch"
With a low noise dummy load and a noise source you could correct both for noise floor/spurii and receiver gain/spectral response (rather analogous to darks and flats in imaging)
Robin
-
1
-
-
On 18/12/2020 at 15:56, woodblock said:
You'd have to make sure that the star image covered a minimum area of the sensor.
As in any imaging, you just have to avoid being under sampled ie the size of the star image (FWHM) should be more than 2 pixels but in this case the size of the "pixels" is twice as big as the size of the actual pixels. (Since you will only be using the green channel it is not actually as bad as this as half the pixels are green)
-
1
-
-
On 20/12/2020 at 11:53, markse68 said:
interesting image as very often they appear like little triangles to me also
Triangles can be a sign of pinched optics. I have a cheap 80mm f5 refractor which shows this beautifully if I tighten the objective lens retaining ring
Cheers
Robin
-
Comparison stars are used to calculate the brightness of the target (and check) stars. Several comparisons can be combined to form an "ensemble" a sort of super comparison star which can improve accuracy and precision.
Check stars are normally just to check the precision and accuracy of the measurement, useful for checking stability eg during a long time series, where the check star graphs should be flat (multiple comparison stars can also be used as check stars, looking for agreement between them)
Cheers
Robin
-
1
-
-
Was going to do a back of envelope calculation but decided the answer must be out there already
https://www.youtube.com/watch?v=oauf6W3Uz04
The barycentre is currently outside the sun
Cheers
Robin
-
6 hours ago, andrew s said:
Different PA to @robin_astro's image but I was in a rush!
Mine is at a crazy angle to fit them in the frame. (the aim was to get them in line vertically but ran out of room!)
-
14 minutes ago, andrew s said:
Nice Robin, it could only be bettered with a colour camera! 😏
Regards Andrew
Funny you should mention that. The idea for this field originally came from Christian Buil when he borrowed my Star Analyser in the early days of it back in 2007 and came back with a version taken with a DSLR. I often use it with permission in presentations on spectroscopy but finally got round to looking at it myself. Here is Christian's colour version on his website. It does look good in colour but his W Per is rather over exposed. (I did a non linear stretch on my image to avoid that so don't try to measure the flux 😉 )
-
1
-
 1
1
-
-
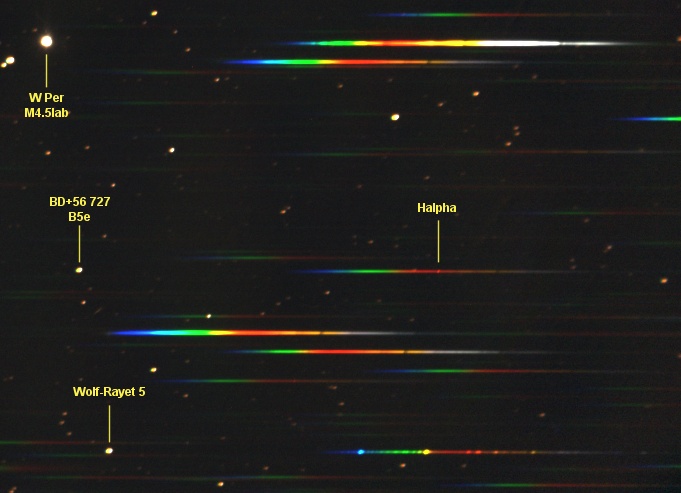
A conventional image of this star field in Perseus (~20x15 arcmin) would look rather ordinary but a diffraction grating (100 lines/mm Star Analyser) placed in front of the camera to spread some of the star light into spectra reveals some interesting astrophysics going on in these stars thanks to the power of spectroscopy. (34x10 sec, Celestron CII, ATIK 314L)
Top of the frame is W Per, a Red Supergiant star and like most other supergiants (Betelgeuse for example) is variable in brightness. Here it is currently magnitude 9.5 measured at visual wavelengths (from the AAVSO database), but much brighter in the Infra-Red where most of the light from this star is produced. (The spectrum here extends out to wavelengths beyond 1 micron, the limit of the CCD sensor sensitivity.) We can tell it is a cool star (spectral type M5i) from the sawtooth shape absorption bands in the spectrum produced by spinning and vibrating molecules of Titanium Oxide which are able to form in the relatively cool (~3000K) atmosphere of this star.
Centre is BD+56 727, a hot star (effective temperature ~15000K) of spectral type B5 with no obvious strong absorption lines in the spectrum, typical of very hot stars. The star should look very blue with the spectrum much brighter at the shorter wavelengths but in this case the spectrum is almost even brightness across the visible range due to the large amount of interstellar dust between us and the star which dims and reddens its appearance. (It is V magnitude 10.6 but the dust absorbs over 90% of the visible light so would look much brighter and bluer without the dust). There is one clear feature in the spectrum though, the bright spot in the red at the Hydrogen alpha wavelength (6563A). This emission line comes from a rotating disc of gas around the star, the hydrogen atoms being excited by the UV light from the star and glowing in H alpha. (It is a Be star, one of many followed by amateur spectroscopists in support of professional astronomers)
Bottom is WR5 a Wolf Rayet star with a spectacular spectrum showing many emission lines. (It is visual magnitude 10.4 but most of the light is concentrated in the emission lines). Wolf Rayet stars are extremely hot (tens of thousands of degrees K) massive stars nearing the end of their life (probably destined to become supernovae.) They are shedding their outer layers in powerful high velocity stellar winds. It is the material in these winds (made up of elements formed by nuclear fusion within the star) which produces the emission lines, variously of ionised Helium, Carbon, Nitrogen and Oxygen, excited by the UV radiation from the star.
Cheers
Robin
-
14
-


How to focus a spectrometer?
in Radio Astronomy and Spectroscopy
Posted
Hi Steve,
As I said in my earlier post, high dispersion gratings with thick wedge prisms like this just don't work at all well with converging beam setups. The aberrations are just too bad so the lines are never in focus. To get a converging beam setup to work you need small dispersion angles ie a low lines/mm grating
Cheers
Robin