


robin_astro
-
Posts
1,209 -
Joined
-
Last visited
-
Days Won
1
Content Type
Profiles
Forums
Gallery
Events
Blogs
Posts posted by robin_astro
-
-
Some school lab diffraction gratings are not too bad. The Star Analyser started out as one of those. (All gratings you can buy are replicas from a master, that has nothing to do with the quality)
The simplest thing you can try is put it in front of a DSLR camera and image some stars with it. It will turn the stars into smeared out spectra. Like this on my website using a Star Analyser but use a shorter focal length lens with your grating perhaps around 20-30mm otherwise the spectrum will be too long and faint. (test it by pointing at a bright street light first before trying on stars)
http://www.threehillsobservatory.co.uk/astro/spectroscopy_11.htm
http://www.threehillsobservatory.co.uk/astro/spectroscopy_17.htm
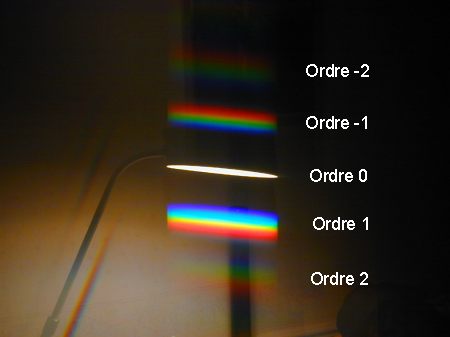
It will work on the brightest stars but how well it works on fainter stars though will depend on the efficiency of the grating. If you look through it by eye at a point light source, you will see some light which goes straight through and several spectra either side of that. If it is a good grating one spectrum will be brighter than the others. Something like this on Christian Buil's website.
http://www.astrosurf.com/buil/us/stage/session0/img2.jpg
All the other light except in that spectrum is wasted light so the more light is in one of the spectra the better
If you want to try something more sophisticated to mount on a telescope here is a simple design also from Christian Buil which would work with your 600 l/mm transmission grating. Use it without the slit so it is simple to use as you don't have the problem of putting the star on the slit and guiding it there.
http://www.astrosurf.com/buil/us/loris/loris.htm
Here it uses a 300 l/mm grating. For 600l/mm you would need to double the angle.
Cheers
Robin
-
 1
1
-
-
Steve,
If you want to see a binary in action in "real time" with the Star Analyser an eclipsing binary like U Cep is a good target. Here by Mike Harlow with an objective prism but the Star Analyser should also show the changes in the spectrum well
https://britastro.org/node/19199
Cheers
Robin
-
2
-
-
18 hours ago, SteveBz said:
Do you think I could improve the spectrum I got, or is that pretty much as good as it gets with the SA? I was pretty sure you had some better resolved ones.
Careful focusing on the specific region of interest and choosing targets at high elevation and nights with better seeing can help but I think that is pretty typical for the Star Analyser used in the conventional way. I use other spectrographs for high resolution work. There are examples using the Star Analyser with combinations of wedge prisms at very high dispersions to get high resolution but these are either objective grating setups (ie mounted in front of the telescope/camera lens) or are high focal ratio setups which reduce the aberrations that the converging beam produces. but these are tricky to use and calibrate compared with the standard Star Analyser setup or conventional slit spectrographs. See the experiments by Uwe Zurmuhl for example in "Spektrum" editions 51 and 55
https://spektroskopie.vdsastro.de/journal-30.html
Resolution is not the only parameter in spectroscopy. You can go much fainter at low resolution and there are lots of interesting targets for the simple Star Analyser including WR stars, bright novae and supernovae and even quasars.
I would say attempting to see the difference between two almost identical spectral types (6,7 Lyr) which will only show the subtlest of differences is not the best place to start though. Perhaps try Albireo instead. The hotter star A8v star would make a good calibration standard and is interesting as it is also a Be star. (Can you detect any H alpha emission line?) and the cooler K2ii star will have strong metal lines so would be a good test of how much you can resolve the features)
Cheers
Robin
-
1
-
-
6 Lyr is also one of the stars in the MILES catalogue of stars (referenced on my web page on flux calibration.) Here it is in the database included with ISIS software.

-
1
-
-
7 hours ago, SteveBz said:
It may be that 6 Lyr also has a further close companion a few AU from it that don't appear in Gaia and that is what is showing in the 6Lyr spectrum.
Yes 6Lyr definitely is a known binary with a close secondary (The orbital period is just 4.3 days) but the secondary is not seen in the spectrum, most likely because it is much fainter. We know it is a binary because the lines in the spectrum from the primary move back and forth on a 4.3 day period. This is known as a single line spectroscopic binary. See the wikipedia page for the reference to the 1910 paper
Cheers
Robin
-
1
-
-
1 hour ago, SteveBz said:
s that not just noise? Or is that some sort of complex metalicity?
No not noise (The SNR is given as 320 which is very high.) If you zoom in you can see the details of the lines. The spectrum is not particularly complex. Even a normal F0v star will show lots of metal lines though they become stronger at lower temperatures eg in G an K spectral types. Here is an F0iv star from UVES POP, another source of very high resolution spectra
Amateurs are capable of high resolution spectra on bright objects like this though. For example take a look at recent spectra by Joan Guarro Flo in the BAA database using an echelle spectrograph built by him from a design by Tim Lester, another amateur. eg here is symbiotic star CQ Dra
https://britastro.org/specdb/data_graph.php?obs_id=10258
again, zoom in to see the detail
Cheers
Robin
-
1
-
-
There is an extremely high resolution professional spectrum of 6 Lyr in the ELODIE archive
http://atlas.obs-hp.fr/elodie/fE.cgi?ob=objname,dataset,imanum&c=o&o=6 lyr
Cheers
Robin
-
1
-
-
8 minutes ago, robin_astro said:
I'm going to run longer exposures next time to see if I can get the companion star's spectrum more clearly.
I am not sure the 6 Lyr binary companion is even visible in the spectrum. According to the wikipedia page it is a single line spectroscopic binary, ie it was discovered to be a binary from the periodic doppler shift in the lines in the primary star spectrum. A literature search though might throw more recent light on this. It is very unlikely you will be able to untangle the components in a low resolution star Analyser spectrum though
-
1
-
-
9 minutes ago, SteveBz said:
Where did you get this from? As I don't imagine it was my spectrum 😢
I'm going to run longer exposures next time to see if I can get the companion star's spectrum more clearly.
From the classification in SIMBAD. I see it even has its own wikipedia page https://en.wikipedia.org/wiki/Zeta1_Lyrae
Your signal/noise is already very high so longer exposures will not give you any more detail. You can already see the characteristics of a hot star eg F0 in your spectrum but you need a higher resolution spectrograph to do detailed spectroscopic classification. Your Star Analyser setup is not suitable for this sort of work.
Robin
-
1
-
-
4 minutes ago, SteveBz said:
This is also a good point. However, it seems likely to me that they are indeed a bound pair.
They may well be but I stand by my original statement, unless you have proof of orbital motion. SIMBAD describes zet Lyr as a double or multiple star
-
1
-
-
If you are interested generally in the sort of research work amateurs are doing in spectroscopy then I can recommend browsing the ARAS forum. This is mostly with equipment more sophisticated than the Star Analyser though
https://www.spectro-aras.com/forum/
For a wide ranging overview of everything spectroscopic from an amateur perspective explore Christian Buil's website
http://www.astrosurf.com/buil/index.html
A good source of amateur spectra is the BAA database
and there are a number of other spectroscopy related resources on the BAA website here
https://britastro.org/node/19378
A good overview of an interesting range of targets for low resolution spectroscopy, many accessible with the Star Analyser is Francois Teyssier's "Low resolution spectroscopy observer's guide" from this page
http://www.astronomie-amateur.fr/
Cheers
Robin
-
1
-
-
1 hour ago, SteveBz said:
Does Vizier also have the actual spectra?
If you follow the references in Skiff's catalogue you will find how the classification was made. In some cases you might find a spectrum but in general the classification just follows from the features seen in the spectrum. Also you can do general research on a particular star by following up the references found by looking it up directly in SIMBAD eg
https://simbad.u-strasbg.fr/simbad/sim-id?Ident=6+Lyr
Gray and Corbally "Stellar Spectral Classification" is the "bible" on how to do spectral classification but more accessible for amateurs is perhaps Richard Walker's excellent "Spectral Atlas for Amateur Astronomers"
A set of spectra of "normal" stars though can be found in the Pickles library found in the various software, which is why I suggested overlaying some on your spectra to see if you can find the best match
7 Lyr should be a good match to F0v
6 Lyr is odd though. This is because it is an Am star.
https://en.wikipedia.org/wiki/Am_star
The classification kA5hF0VmF3 means it looks like an A5 star based on the strength of the Ca II K line but F0V based on the strength of the Balmer lines and F3 based on the strength of other metal lines. At your resolution I expect it will look like an F0v so similar to 7Lyr with similar strength Balmer lines.
Spectroscopic classification is not a big area of interest for amateurs though as it has mostly already been done. Most amateur research work in spectroscopy is on stars that are unusual in some way or vary in interesting ways.
Cheers
Robin
-
1
-
-
Note that while zeta Lyr is visually a double star it is not necessarily a binary pair. To be a binary the two have to be gravitationally bound ie in orbit round each other
Robin
-
1
-
-
7 Lyr is straightforward. It is an F0v star, a main sequence star hotter than the sun (G2v) but cooler than Vega (A0v) for example. Its spectrum is dominated by strong Hydrogen Balmer lines. You could try overlaying the F0v spectrum from the Pickles library
6 Lyr is much more complex, it is a binary so a mix of spectral types and at least one of the components has an unusual metal composition which further confuses the classification (ie the spectral classification is different depending on which lines you look at) so is classified for example as kA5hF0VmF3
To see these features though you would need a much higher resolution spectrograph than the Star Analyser and overall, Hydrogen Balmer lines again dominate your spectrum.
To see the published classifications for a particular star I can suggest Brian Skiff's huge Catalogue of Stellar Spectral Classifications"
http://vizier.u-strasbg.fr/viz-bin/VizieR?-source=B/mk
Note though that it is only possible to make an approximate spectra classification at the resolution of these spectra. To do this accurately needs higher resolution and some specialist knowledge
Cheers
Robin
-
1
-
-
I suggest scaling them so that the intensity is 1 at the same wavelength which makes them easier to compare independent of their brightness. (550nm is commonly chosen).
-
1
-
-
You would need to watch out for flat field effects as the two measured spectra will be in different places in the field. (Best avoided with slitless spectra by placing the target and reference spectra in the same position) You could perhaps test for this by taking an additional spectrum with the 1st grating at a diagonal (adjusting the dispersion to match that of the combined spectrum) and comparing the shape with that of the horizontal spectrum
-
1
-
-
3 minutes ago, vlaiv said:
If zero order image is not the same as original source - and first dispersion is in effect producing number of "sources" for second dispersion - we don't have recording of those "sources" - only zero orders of those "sources".
You first measure the horizontal spectrum without the second grating in place
-
1
-
-
18 minutes ago, vlaiv said:
Follow up question with regards to above - do we know for sure that Zero Order image is unaffected by grating response?
Above can only work if zero order image has same spectrum as the source (only attenuated) - otherwise it won't.
The light in zero order is not the same as the original source. It is the undiffracted light so the spectral content is the inverse of the combined grating responses but that does not matter. All we are using the first grating for is to produce a horizontally dispersed light source which is then modified by the second grating. The light in the diagonal spectrum only comes from this dispersed light source. The ratio of the light at a given wavelength in the diagonal spectrum to that in the horizontal spectrum then gives the efficiency of the second grating at that wavelength. (It probably should not be used to give an absolute efficiency measurement but the variation in efficiency with wavelength should be correct.
EDIT (change horizontal for vertical to match your diagram)
Robin
-
16 hours ago, vlaiv said:
Or similar question - if I 3d print front aperture grid (assuming I can print that fine) - will "air gaps" have response of 1? (does grid affect response in any way - or is it just optical properties of material in gaps?).
An interesting question. Does a theoretical perfect unblazed transmission grating have a flat response? I dont know and have not yet been able to find the answer on line.
One potential way of measuring the response of a transmission grating without a calibrated light source could be to use 2 transmission gratings at 90 deg. The first disperses the light into a horizontal spectrum and the second then disperses this spectrum vertically. The resulting diagonal spectrum divided by the horizontal spectrum should give the grating response.
Robin
-
1
-
-
31 minutes ago, robin_astro said:
for a good example while it is bright enough I recommend looking at the recurrent nova RS Oph if it is high enough for you. It is in a rare outburst (every 15-20 years) and has and interesting spectrum for the star analyser.
Another good one currently for the Star Analyser is Nova Cas 2021. It exploded back in March but unlike most novae it refuses to fade and has been bouncing around mag 7 ever since. This is the AAVSO light curve
and an ALPY 600 spectrum I took a couple of weeks back, here in the BAA spectroscopy database
https://britastro.org/specdb/data_graph.php?obs_id=10399
There is a long thread on it here
Cheers
Robin
-
14 minutes ago, vlaiv said:
I want to be able to measure camera response. It has to do with imaging and color reproduction.
Yes camera response is tough to measure as you need both a calibrated light source and spectrograph or a reference sensor to compare with. If this is scientific astronomical imaging though the atmosphere will also have an affect so you could use a similar process to that used in spectroscopy/photometry , matching the colour of a known star, typically making G2v stars in the image white
Robin
-
Just now, SteveBz said:
I did, and it was sort of close but not perfect.
It does need practise and for amateurs +-10% error in the shape of the continuum is about as close as you are likely to get (If you want to hone your skills try a few stars with known spectra to see how close you can get as I did in the examples on my website) At the end of the say though it is the features in the spectrum not the exact shape of the continuum which is most important as they contain most of the astrophysical information so don't get too hung up about response correcting, particularly with the Star Analyser which I developed to give a relatively gentle introduction to the subject and is mainly best for targets which show clear strong features.
for a good example while it is bright enough I recommend looking at the recurrent nova RS Oph if it is high enough for you. It is in a rare outburst (every 15-20 years) and has and interesting spectrum for the star analyser. This is what it looked like back in 2006 with the Star Analyser
http://www.threehillsobservatory.co.uk/astro/spectra_24.htm
and this is what it looks like currently with my ALPY 600 spectrograph, from the thread covering this outburst
Cheers
Robin
-
Just now, SteveBz said:
My issue, really, is that it's very manual and, for me at least, very error-prone. I was wondering how I could use the effect of averages to reduce the error.
A good quick check that your response is sensible is to apply it back to your reference star and make sure the result matches that from the library (again in my document)
Robin
-
1
-
-
2 minutes ago, SteveBz said:
that you need a set of compensating corrections for each physical situation eg one for every 10 degrees of Az, maybe.
Still not good enough I am afraid as atmospheric conditions can be different from night to night even at the air mass. You still have to make a measurement of this on the night for best accuracy. If you are familiar with photometry it is the same as doing differential photometry
Robin
-
1
-


MiniSHG and Baader 7nm Ha filter
in Radio Astronomy and Spectroscopy
Posted · Edited by robin_astro
added possible slit diffraction effect
Hi Ken,
What's causing emission peaks round the sharp absorption lines ? Is this some sort of sharpening/compression artifact?
Or a diffraction effect off the edge of a very narrow slit perhaps?
Robin