


vlaiv
-
Posts
13,106 -
Joined
-
Last visited
-
Days Won
12
Content Type
Profiles
Forums
Gallery
Events
Blogs
Posts posted by vlaiv
-
-
20 minutes ago, cuivenion said:
Thanks Vlaiv. I was going to use the HDR combination tool in Pixinsight, it's seems like that will be easier to get my head around than the pixel math method. I have the commitment but not the brains unfortunately. I'm unused to messing around with pixel values.
It looks like HDR combination tool will do exactly what I described - so you should use that, here is article about it:
https://www.lightvortexastronomy.com/tutorial-producing-an-hdr-image.html
Mind you - it advocates use of 64bit precision - but I don't think its necessary. In fact I was earlier concerned if 32bit can give enough precision when doing large number of subs stacking - but I neglected the fact that it is floating point precision, so 32bit float point is generally sufficient for all operations on the image.
If you read thru that tutorial, you will find that we agree on some points like this one:
QuoteBinarizing threshold is perhaps the most important parameter that can be tweaked. The default value of 0.8000 works very well in most cases. This parameter helps define the areas of pixels from a longer exposure image that are replaced by a shorter exposure image (in terms of their relative brightness).
It is very much equivalent to mine: replace pixels with 90% or higher value ... (I used 0.9 value in my example, but 0.8 is perfectly valid as well - will not make much difference).
-
 1
1
-
-
Stacking images is in fact HDR imaging even if single exposure duration is uses.
But above observation does not answer your question.
We are satisfied with image once we have high enough SNR. For bright stars and bright central core of galaxy, single short exposure will result in rather high base SNR hence you need just a hand full of them to make them with enough SNR to go into the image.
One approach that will work good - take a few short exposures (like 10-15 seconds is enough) and stack those using average method (no fancy stacking needed there). Scale pixel values to match those from long exposure (multiply with ratio of exposures - if base exposure is 5 minutes and short exposure is 10s - multiply with 10s/300s = 1/30 - or divide with 30 same thing).
Now that you have matching photon flux it is the simple matter of blending in two stacks and you can do it with pixel math (or similar tools):
for pixel math it would be something like : resulting pixel value is equal to long stack value if value is below threshold (set it to something like 90% of brightest pixel in long stack) - else use pixel value from short stack.
for other kind of blending - make selection of all pixels in long stack that have higher value than 90% of highest value in the image. Copy pixels using same selection (long stack and short stack need to be registered / aligned) from short stack and paste them onto that selection in long stack.
-
2
-
-
9 minutes ago, AngryDonkey said:
Sorry for being thick but are you saying that what I said was true or not? 🤣
Indeed it is - at least in the way I'm advocating for people to think about signal / image.
One might argue that we use word signal to describe different things, and indeed I'm guilty of that in many previous discussions on topic of signal and signal/noise ratios and such (sometimes we take shortcuts and don't express ourselves properly).
Problem with that approach is: If we think of signal as measured value and not intrinsic property of the source - we could be arriving to wrong conclusions. Namely following couple seems to be common:
- You can't record image / display image with low measured values, or rather image that has average numerical value of 1 will be somehow better quality than image that has average numerical value of 0.0001. This can stop one seeing that it is not absolute values that are important but rather ratios of measured values (one pixel being twice the value of another and three times value of third and fourth ...). Image is relative pixel values - regardless of absolute values that we assign to each of the pixels as long as we maintain their ratio (describe them in compatible units - be that photons per hour or per millisecond) - in fact to make image presentable we often give up their proper ratios and introduce non linear transform (but that is extension to this topic).
- Some subs contain no signal. Suppose that we have source that for our purposes emits one photon per hour and we take one minute subs. As many subs would end up with measured value of 0 - if we associate word signal with measured value as opposed with intrinsic property of source - we can conclude that many of those subs are in fact wasted - they did not capture anything - no "signal" is present on them - but we would be wrong in thinking so. If we follow that line of thought - nothing would prevent us from discarding such subs (as they are meaningless contain no signal) - however if one does that - they will end up with wrong image.
From previous point, extension (that can sometimes be heard) - you can't record target that is too dim for single exposure, or you can't record signal that is below noise level in single sub.
In any case - if we associate term signal - with intrinsic property of object (or shall I say object / setup relationship) and understand that each sub contains the same signal, it opens up possibility of easier understanding of the whole process of image acquisition and also histogram manipulation. It can help one understand what image really is (in data / pixel values sense and their relative ratios). It also helps understand signal/noise ratio - and how ultimately that is only important thing for a good image.
-
4 hours ago, Merlin66 said:
If the sensor records say 10 photons in one minute, then over ten minutes it will receive and record 10 x 10 photons.
This is very good start for understanding
We have 10 photons per minute and we have 100 photons per 10 minutes. Are those two different?
The reason I said that we should leave noise for now is because noise is related to measurement. It is not "intrinsic" property of signal. Signal is what it is. Act of measurement introduces noise in resulting numerical value, and the way you measure will impact how much noise there will be.
If you measure above signal for one minute - you will conclude that it is in fact 0.1666 photons / second, but the noise associated with measurement will be related to how long you performed measurement for - SNR will be 3.1622776.... (if we imagine perfect system - no read noise and such). Once you measure for 10 minutes - you will also conclude that signal is in fact 0.166666 / second - but noise associated with measurement is less - SNR will be 10.
Same goes for stacking with average - measured signal will be the same (but noise will be reduced due to repeated measurement).
Point being - there is no sub that contains no signal - all subs contain signal and they contain exactly the same signal, even 0.0001s exposure sub will contain that signal. Difference is only in the noise associated with each measurement. We could argue that numerical value that we got from measurement is also different - but that is really not important - it's a bit like saying I'm "27 tall" (ok, but what units, can we compare that to someone else's height?), or maybe my speed is 27 kilometers (per minute? per hour? per day?)
I think above way of thinking is the key for understanding that it is all about SNR and that measured numerical value can be arbitrary large or small - it will not matter as long as we are happy with level of noise in our measurement.
-
12 minutes ago, Merlin66 said:
1. Has the lowest target signal and low SNR
2. Has an improved target signal, but similar to 1. due to the averaging, but an improved SNR (1 sigma)
3. Has a much higher target signal due to sum but similar SNR to 2.
4. Similar to 3.
Here is a hint:
Let's leave noise part aside for a moment as it is related to measurement. We are not talking about measurement here - we are talking about signal strength regardless of measurement.
-
This is actually almost a trick question - but I feel one that needs to be answered, as I believe many people doing imaging don't in fact know the proper answer to it.
In recent discussion with @Rodd about ins and outs of stacking and SNR - this came up and it occurred to me that many people would not be able to answer it properly. Here is question in a nut shell:
Given same scope, same camera, same target and sky conditions, with only signal in mind (disregard noise for the moment), how do signal levels compare in following cases:
1. Single one minute exposure
2. Average stack of 10 one minute exposures
3. Sum stack of 10 one minute exposures
4. One 10 minute exposure
What do you think?
-
Cross "flares" or diffraction spikes are feature of reflecting telescope that has spider support of secondary mirror. It has nothing to do with eyepiece.
Take your 25mm eyepiece and point a scope to very bright star - you should be able to see it as well. You can also see it in images like this one:

Just look around internet for astro images - and you will find images with stars that have cross shape.
Outer field in Panaview can suffer from what is called coma as well - this is related again to telescope design and nothing to do with eyepiece (but wide field long focal length eyepieces make it more visible). It looks like this:
Main fault of the eyepiece will be "seagull" like star shapes at the edges, a bit like this:
Or combined with above coma - more like this (wings come from astigmatism and tail from coma):
-
5
-
-
I hope you don't mind me posting this analysis - I just wondered what is it that makes stars stand out like that. Not something that I can easily quantify with words.
It turns out that you have slight "terrace" in your star profile in some channels that eye/brain is not used to (we usually see and expect smooth profile - smooth transition from star to background - much like gaussian shape), but in your image above, this is what happens:
Green channel:
Blue channel:
Red is for most part and does not suffer this:
Trick would be when processing stars separately to make transition smoother and more gaussian like without this terrace effect.
-
Very nice image.
In fact only "objection" that I have is that usage of starnet is a bit obvious. I concluded that you've used it without really reading it in your image description. There is something about star - nebula transition that makes it too "hard", but this can only be seen in close scrutiny.
-
4 hours ago, Samantha said:
Thank you for getting back to me. Basically if i understand it right then when i take either photos or do recording if i put the gain settings on something like 30% for example that would make the image bright enough on both recording and photographing with it ?
There is no real distinction between video and photograph as far as sensor goes - video is just fast sequence of individual photographs put together. For that reason we can talk only about single photographs or what is sometimes called exposure.
Maybe best way to explain actual use of gain is via analogy and example. What I'm about to say is related to single exposure or video feed, it does not relate to advanced techniques used for producing an image from telescope. It is best if you take things slowly and don't dive into all complexity at once - most people get overwhelmed by it.
Imagine you have a water tap, and a bucket. You can open up tap and water will flow and it will take some time to fill the bucket. If flow is stronger it will take less time to fill the bucket. If bucket is larger it will take more time to fill it. There is relationship between strength of flow, size of bucket and time it takes to fill it up (or fill it 3/4 or half of it).
Strength of flow in above analogy is amount of light from target - not all targets have same brightness. Some stars are brighter than others - same is true for nebulae, clusters and galaxies.
Size of bucket is analogy for gain. Low gain is large bucket, high gain is small bucket.
Filling time in this simple analogy is exposure time (how much it takes to make a single image).
For image to be bright on screen, you need to "fill the bucket". If target is not bright in single exposure, you can do two things - either use "smaller bucket" (that will fill faster) - increased gain, or take more time to fill it up - longer exposure. If target is bright enough you can use short exposure and larger bucket.
For simplicity - leave gain at something like 30% - and try to take image. If you can't see target, first try increasing exposure length - it is not uncommon to have exposures that last for dozen of seconds. If you still can't see the target in long exposure - then raise the gain.
Hope above makes sense.
4 hours ago, Samantha said:The other thing i have is where i live i got problems of street lights and a neighbour on other side of our street which is a diagonal house is there a way i can even though i got no dew shield to take the light out or just use my telescope cap cover and take one cap off still can do photography and recording?
Light pollution is common problem for many people enjoying this hobby. Don't be tempted to put cover on the scope to stop surrounding light getting in. It will prevent some of surrounding light from getting in but it will also prevent light that you want to get - that from your target, from getting in the scope - and net result will be worse image.
4 hours ago, Samantha said:Because when i got when neighbour light come on due to people not only walking by but vehicles in our street triggering it will that cause same as led streetlights effect the imaging mode to point i still have to go brighter again or go darker down to about 20% to cut out that excess light? This is the problem where i live there is way too might light pollution and i only have one place i can go to do not only observing etc but is the only dark sky recognised place at the moment which makes it difficult trying to find right balance of taking out any unwanted lights aswell.
Using camera is rather nice way to still be able to "observe" (or rather record / look on your computer screen) astronomy targets. This is because light "adds" so your camera will record sum of light coming from light pollution and light coming from target.
Way to deal with light pollution in this case is to "subtract" it from the final image. Light pollution is relatively uniform and it will just be uniform signal in your image. There is something called "black point" in the image that you can often adjust - either in your capture application or in image processing application. By adjusting this black point, you are in fact subtracting that uniform light pollution glow.
Light pollution will hurt your image in other ways - so it's best to have as minimal light pollution as possible, but understanding of that is also a bit advanced and best left for later once you master basics.
Try to see if your capture application has options for what is usually called Histogram manipulation, or black point. Adjusting those will let you see the target regardless of any light pollution that might get into the scope.
-
Unfortunately, good imaging refractors tend to be a bit more expensive so there is no cutting corners there.
However, not all is lost here. Above scope produces less chromatic aberration than one would expect from fast achromatic doublet of that aperture. You can further reduce it by few tricks.
You can try using Wratten #8 filter in front of camera. Not sure if there is clip in version, but you can get 2" version and screw that in your DSLR adapter (if it is 2" one).
Another trick is to use aperture stop. This can be simple cardboard with circular cutout at the center placed over telescope aperture (just make sure it is centered and cut out is clean without rough edges). This will reduce amount of light entering your scope so telescope will be slower - you will need to expose for longer to get nice image (same as stopping down the lens).
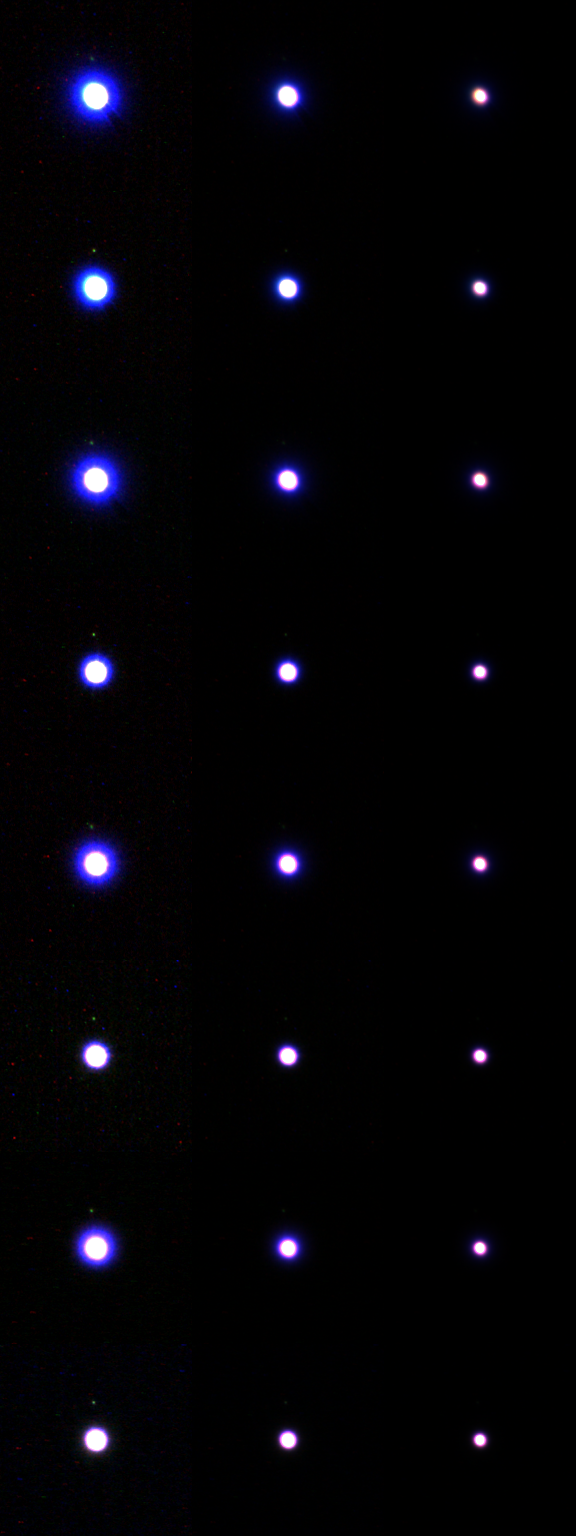
Here is comparison of stars in similar 100mm F/5 scope when using first, second and combined approaches:
Columns contain same image of star but stretched to different level (strong, medium and light stretch). Rows contain following: clear aperture, clear aperture + wratten #8, 80mm aperture mask, 80mm+#8, 66mm aperture, 66mm + #8, ....
I think that for that scope I found that 66mm aperture mask and #8 produces image with virtually no chromatic blur / halo.
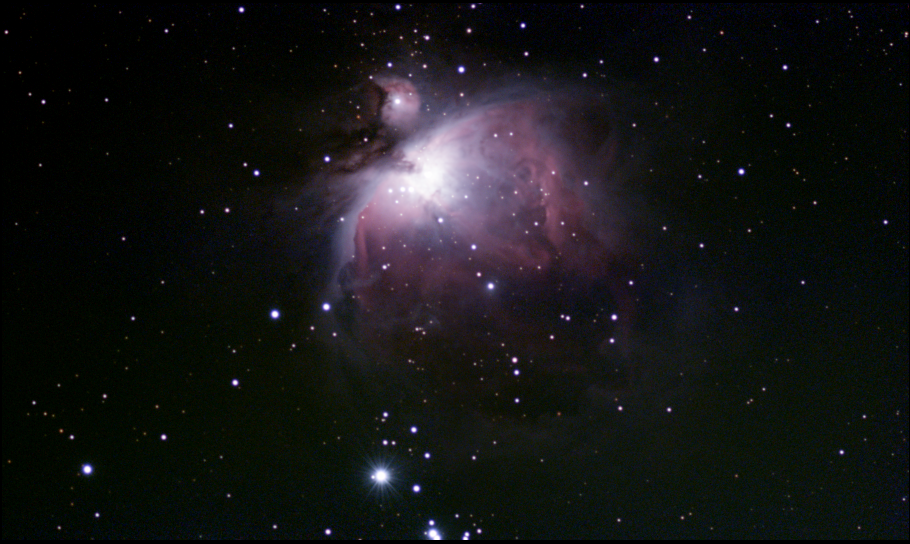
Following image was taken with such combination:
As you can see there is no purple halo around stars that can be seen (but note spikes / rays around bright stars at the bottom - that is because aperture mask was not cut smoothly).
For reflections - that depends on filters that you use, and sometimes it is unavoidable. If they are caused by filters or similar - you might try to replace used filter to see if that helps. Sometimes only thing that you can do is fix that in post processing.
Here is example of filter reflections in my RC scope. This was due to UHC filter used:
here is doughnut of light around that bright star. I switched to narrowband filters instead of UHC and did not have such issues any more (although NB brought their own issues - such is AP, constant struggle
 )
)
-
3
-
-
Hi Samantha and welcome to SGL.
Gain is a bit like volume on your computer speakers. When you turn the volume up - you hear louder music, when you turn volume down it becomes quieter. If you turn it down too much you won't be able to hear anything and if you turn volume too much up - sound will get distorted. Similar thing happens with gain when you are recording - either video or still image with your camera. Gain controls brightness of your recorded image. Too low gain and image will be dark, too much gain and image will be too bright. Keep gain somewhere in the middle to get nice looking image.
Fact that you are getting white or yellow image is quite all right. Astronomy cameras come without lens attached and what you see is just unfocused light being picked up by camera. Telescope acts as a lens and when you attach your camera to telescope and find proper focus - image will be nice and sharp.
-
I'm somewhat confused with what you've written.
10 minutes ago, Mick W said:The scope is supposed to be an achromatic doublet but the results don't bare that out or am I doing something wrong? As you can see from the Pleiades there seems to be massive chromatic aboration around the main stars.
If scope is achromatic doublet - then purple halo is very much to be expected. In fact in bottom image, level of purple halo is much less than I would expect from F/5.5 achromatic doublet. You need at least slow well corrected ED doublet to avoid chromatic aberration if not proper APO triplet.
13 minutes ago, Mick W said:In the image of Capella there is a purple halo but that also shows up when I use my reflectors.
This one is confusing because I suppose first image is of Capella, right? It has diffraction spikes and no chromatic aberration visible at all - that image was in all likelihood taken with reflector and not refractor. Thing that is in image that could be interpreted as some sort of halo around star is just unfocused reflected light. Setup used to make that image has some optical element that is not properly coated and that results in reflection halo (Maybe everything is properly coated - Capella is such a strong star and produces so much light that there is bound to be reflection artifact visible in long exposure).
-
I'm under impression that mono + RGB filters actually have smaller color gamut than OSC sensors (that strictly depends on filters used - but let's go with "regular" filters - ones that split 400-700 in tree distinct bands).
In order to calculate color gamut, we need to first find appropriate raw -> Cie XYZ transform (and color gamut will depend on it) and then see what range of xy chromaticity diagram it will cover.
Brute force approach is completely infeasible, splitting 400-700nm range in very coarse steps of 10nm will yield 30 divisions, and using only 10% intensity increments will lead to something like 10^30 combinations to be examined.
I've tried searching the internet for information on sensor color gamut estimation / calculation - but have found numerous articles that in fact state that sensors "don't have gamut" - statement which I disagree with. Maybe it is because I don't have proper understanding of the term gamut? Can't be sure. In any case, here is what I mean by color gamut of sensor + filters and what is brute force way to calculate it. Maybe someone will have idea how to simplify things and make it feasible to do calculation.
First let's define what I believe to be color gamut of the sensor. Examine following graph of QE efficiency of ASI1600:
Note section of the graph between 600 and 630nm - it is mostly flat line. Let's assume it is flat line for the purpose of argument. Now let's look at following graph of Baader LRGB filters:
Again observe same 600-630nm range. Red filter covers it, and there is tiny variation of transmission in this range, but we can select two points that have the same transmission. Let that be for example 605nm and 615nm.
If we shine same intensity light from two sources - one at 605nm and one at 615nm - camera sensor combination will record two exactly same values - there will be no distinction. We will get value of let's say 53e in red filter. Nothing in blue or green filter.
But important thing - given these two images (of two light sources) - we can't even in principle distinguish which one was 605nm and which was 615nm.
Now let's examine human eye response:
On above graph there will be difference in both L (long wavelength type) and M (medium wavelength type) cone cells. Our eye will be able to distinguish these two light sources as having different color.
This clearly shows that camera + filter combination that we are examining has less color gamut than human eye (although articles insist that neither human eye nor camera have color gamut - and that only display devices have color gamut - statement that I strongly disagree. In fact color gamut of display device is only defined in terms of human eye sensitivity - it can be larger or smaller if we take some other measurement device / define color space differently).
Now that I've explained what I mean by color gamut of sensor - let's see how to calculate/measure it. I'll explain brute force approach and why it is not feasible to do it.
Let's first look at well defined color space of CieXYZ and xy chromaticity diagram:
Here are matching functions for CieXYZ:
Now imagine any arbitrary function that spans 380nm-780nm and represents spectrum of the light of particular source. Take that function and multiply with each x, y and z matching function and integrate (sum area under resulting curve) - that will produce X, Y and Z color space values. Important thing to note is that different spectra will produce different X, Y and Z in general - but there will be very large number of spectra that will produce same X, Y and Z values. There are many different spectral representations of the same color. Pretty much like in above example with ASI1600 + RGB where I shown you two different single wavelengths that produce same response on sensor. With CieXYZ any single wavelength will have different XYZ values but there will be combination of wavelengths at particular intensities that produce same XYZ values. For CieXYZ that does not mean less color gamut - because CieXYZ is modeled to represent human vision - if XYZ is the same - so will be color that we see. If we can't distinguish difference - same is true for CieXYZ.
After we have XYZ values - we do a bit of transform to get xyY color (which means that apparent intensity is matched and xy coordinates represent pure hue in max saturation). If we take every possible light source spectrum and calculate XYZ and then derive xyY and plot x,y we will get this function:
Everything inside that curve is what we can see. Points on curve represent pure wavelengths of light.
Determining color gamut of the sensor can then be viewed as:
- take all possible spectra in 380-700nm range.
- calculate rawRGB values (multiply with sensor/filters response and sum/integrate surface under curve)
- transform each of those rawRGB values into XYZ values with appropriate transform matrix
- transform XYZ to xyZ, take x,y and plot a point on above graph
- take all xy points that we produced and see what sort of surface they cover - larger the surface, higher gamut of sensor/filter combination.
Compare that with sRGB gamut, or between sensors or sensor/filter combinations to see what combination can record how much of proper color information.
Problem is of course if we try to generate all possible spectra in 380-700nm range - as there are infinitely many of them. Even if we put any sort of crude restrictions on what the spectrum should look like we still get enormous number of combinations. If we for example say that spectra looks like bar graph with bars 10nm wide and with possible values between 0 and 100% in 10% increments - we still end up with something like 10^32 combinations to examine.
But we have seen that some spectra end up giving same result - so we don't need to examine all possible spectra to get rough idea of what sensor gamut looks like.
Anyone has any idea on how to proceed with this?
-
What sort of composition of Ha and OIII did you use?
I can see two issues with right image that don't "appear" on left one.
First is related to how human eye sees color, it is matter of perception. Not all colors when saturated to maximum have same "brightness" (we don't see them as equally bright). Here is image that can show you that:
If you don't pay attention to numbers - and just look at two sets of circles you will notice that left set of circles looks equally bright as right one (only missing the color - left one looks like right image in monochrome). Numbers are percent of full brightness. So red color carries about half the brightness of same intensity white.
When you stretch your data in mono / black&white (Ha data for example) and then apply red color to it - it will loose some of the perceived brightness because you are in fact just coloring it.
That is the reason why left image looks more pronounced than the right, although respective intensities of white and red are equal.
Another thing that does not look right with right image is color gradients. When you have mono image that is full of nebulosity - it is hard to tell that there is gradient. Our brain just interprets that as part of nebulosity.
Once you add color in that - gradients become obvious as "out of place color" - that is another thing that is happening to the right image.
You need to remove those gradients to get better looking image.
-
Ah forgot to add.
Depth of focus layering is also used in macro photography with fast lens - maybe look that up online to see if there is any free software that you can use?
Often called focus stacking as well.
Here is what quick search gives on this topic:
https://www.cambridgeincolour.com/tutorials/focus-stacking.htm
-
2
-
-
Seems that above link has enough info on the topic that I wanted to touch on - mind you, I know next to nothing on how it works with microscopes
I'll just talk about resolution then.
8 minutes ago, jetstream said:Ok, some info says the final "magnification" is dependent on the screen size? how so?
she has a small tablet- can this limit the resolution depending on its own screen pixels?
In my initial answer I mentioned that there is two ways of seeing image on the screen (there is actually whole ranges in between but those two are significant "points" on this scale) - 1:1 and screen size.
If you view image in "screen size" - then resolved detail and size of objects will be related to two things - size of your screen (and it's pixel count resolution) and size of your sensor - that is physical size. Number of pixels on sensor will not matter as image will be either enlarged or reduced to fit the screen.
"Zoom factor" is therefore function of device screen size. With resolved detail its a bit more complicated and depends on pixel resolution of screen and camera. If camera has less pixel resolution (number of megapixels) then screen - it will be limiting factor, but if it has more - then screen pixel count becomes limiting factor. This is all provided that microscope resolving power is greater or equal to what sensor can record (sampling rate - also mentioned above).
Huh, this is becoming really complicated real fast
. I was hoping to explain it in simple terms, but not sure if it can be done. I think we need to approach this from the other end. I'll again make number of points - it's sort of easier for me that way.
1. Target size and sensor size. With telescopes it is about mapping angles on the sky to the sensor - target is at "infinity". With microscope, target is at finite distance - and has some physical size. Sensor has some finite physical size as well. Magnification in this case will be ratio of two things - physical size of target (expressed in mm for example or um) and size of that image on sensor or in focal plane (again expressed in mm, um or whatever units of length). Let's say that you observe object that is 50um in size and you do that with x100 magnification. Image of that object in focal plane will be - 50um * x100 = 5000um = 5mm. It will be 5 millimeters long (diameter, side, whatever dimension we are talking about). If sensor is large enough (some sensors are for example: 7.4mm x 5mm, that would be ZWO ASI178 sensor) it will capture whole image.
2. pixel count of the sensor. Let's imagine that object has it's length 50um and that we observe it at x100 - then, it will cover 5mm on our 7.4mm wide sensor - there is plenty of room. How many pixels will that image be long? You can answer this question in two ways. First is to use camera pixel count resolution (mega pixels, or rather width x height spec), another is to use pixel size (or sometimes called pixel pitch). Let's use first approach - mentioned ASI178 has 3000 x 2000 pixels - we can use proportion to get how many pixels object will use up: 3000:7.4mm = X : 5mm (sensor x pixel count : sensor width = target pixel count : target width) => X = 3000 * 5 / 7.4 = 2000 pixels wide. Another approach is to use pixel size. This camera has 2.4um pixel size so size of target in pixels will be 5mm / 2.4um = 2083.333
These two differ a bit, so which one is correct. In fact - both are probably slightly off as manufacturers never give you precise sensor size nor pixel size, so in fact this sensor might be 7.3982 mm in width and pixel size could be 2.3925 or something like that - they always round things up, but that is good enough for rough estimation. We can say that image of our object will be 2000 pixels across (give or take).
3. Actual resolution / details in the image. This is very tricky one, and I have no clue how to go about it with microscopes. It is related to sharpness of objective and other things that I know nothing about with microscopes, but it limits how much detail you can have. You can't zoom to infinity and get sharp image - at some point there simply wont be any more detail in image even if you zoom more (same as with telescopes - there is maximum magnification that can be used).
Given link as far as I can tell provides you with some guidelines on this. It will limit pixel size that you should use - any smaller pixel will just make object be larger in pixels (in number of pixels across - see point 2) but image will look blurry.
4. Now that we have our image with certain number of pixels - in our example it is 2000 pixels, we need to look at it on screen. How large will it be? That depends on how you present that image on the screen (viewing application).
Let's say that we use tabled with 1280 x 720 resolution. If you use screen size and put whole image on screen, then object on the screen will take up same relative amount of space as it took up on sensor. Sensor size was 7.4mm and object image was 5mm (or sensor x pixel count was 3000 and object was roughly 2000 pixels) - so it took up 2/3 of sensor width. It will take 2/3 of screen width as well (this is why we call it screen size - sensor image is just mapped to screen so object sizes on image will be relative to size of the screen). Actual object size in pixels will be 1280 x 2/3 = ~853px.
Although you have 6mp camera and you used quite a bit of zoom - you ended up observing object with only 853 pixels in this case.
What if we use the same tablet but our viewing application allows us to use 100% zoom or 1:1 pixel mapping? Then you won't be able to fit whole object onto the screen as it is 2000px across while screen shows only 1280. You will only see a piece of object at one time - and you will be able to pan /scroll around to see all parts of it (but never whole). This is showing you the best "resolution" - or most detail (provided that system could resolve target to that level).
There is range of zooms in between these two points (and actually further out on both sides) - so you can have more zoom out than screen size - image becomes smaller and applications usually fill rest with black frame or similar. You can zoom in more than 100% zoom. Stuff on screen will be larger - but there will be no additional detail, things will get blurry. Best is to keep zoom between 100% and screen size - that way you can see things at best resolution, fit whole object of interest on screen and also observe whole "field of view" (at screen size).
Again, hope that above is understandable.
-
2
-
-
Not sure what the question is, so I'll just shoot some facts and maybe those will cover your question and give you answer. If not we can expand on that.
1. MP count is related to number of pixels on sensor. 1.3MP stands for roughly 1300000 pixels. 1280 x 1024 - means count of pixels in each row and number of rows. Multiply that two figures and you get total number of pixels. 1280 * 1024 = 1310720 or roughly 1.3MP. On the other hand 1600x1200 is in no way 5MP camera as 1600 * 1200 = 1920000, or 1.9MP camera. For camera to be 5MP you need something like 2500 x 1900 or similar "resolution"
2. Resolution is such a broad term and is used in many contexts - that sometimes leads to confusion. One of usages is related to pixel count of sensor. More pixels on sensor means more "resolution". It is used in similar context for computer screens - larger resolution means more display pixels / dots on the screen (like hd ready resolution is lower than full hd being 1280x720 vs 1920x1080 and that is lower still than 4K resolution - 4096 x 2160).
Another usage of the word of resolution is - how much detail there is in picture in the first place. Blurry image will have low resolution regardless the number of pixels used to represent that image. That can lead to funny construct like: "This low resolution image is recorded in high resolution"
(first usage of resolution is level of detail - second is pixel count).
In astronomy (or specifically astro photography) we have additional meaning of that word (could be related to microscopy as well) - resolution of the telescope / system (how much detail it can potentially reproduce at focal plane) and sampling resolution - which gives ratio of sky angles to pixels on sensor (after projection) - expressed in arc seconds per pixel.
3. Image can be viewed on computer screen in few different ways. One of those ways is 1:1 - or 100% zoom (sometimes referred native resolution - yet another usage of term resolution - btw native resolution can mean something else entirely
). This means that one image pixel corresponds to one screen pixel. Size of the portion of the image that can be shown like this is determined by screen resolution. If you view your image on 1920 x 1080 screen but the image is 1280 x 1024 - it will not take up whole screen. If image is on the other hand something like 3000 x 2000 and viewed 1:1 on 1920 x 1080 - you will only see 1920 x 1080 portion of the image and you will be able to "pan around".
You can view image on computer screen in "another mode" - something often referred as "screen size". That is the size of the image adjusted so it fits as much of display screen it can. If image is smaller (in resolution - pix count) than screen resolution (again pix count) - it will be enlarged. If it is larger - it will be reduced in size. In any case - display resolution will be equal to screen resolution (both terms resolution mean pixel count).
Hope above is not too confusing and it answers your question.
-
1
-
-
HSO for me!
Although I have nothing against green of SHO, second one is more appealing to me, and I have sense it is better processed as well.
-
1
-
-
Can't help much there except to somewhat confirm your experience.
Two months ago I did my first purchase with FLO. Got tracking code and everything and a month later - item arrived
(hows that for speedy service) - of course it was sent to Bosnia first and then returned to UK only to be sent to Serbia after that (proper destination).
This was one and only time I've purchased something from UK retailer, but not the only time I had that happen. My TS80 APO went on a trip to Romania once
, and that gave me quite a scare, as such item can go out of collimation in transport, but luckily everything was fine and it reached me after three weeks. I purchased a number of items from TS in Germany and that was the only time shipment made a detour.
-
1
-
-
Ok, it looks like I'm on to something in solving this puzzle.
For a moment I thought that there can't be any other reasonable solution except that maybe random generated numbers are not random in true sense. It occurred to me that computers use pseudo random number generators - and these tend to be cyclic in their nature (although for most purposes they are indeed random). Maybe it happened that by pure chance I tested my algorithm on configuration of data that somehow exploits cyclic nature of PRND.
To be sure I devised an experiment - it would consist of generating random noise image of 900x900 pixels and doing two approaches to generate same data set - one would be use of fractional binning and then splitting image in 4 sub sets and measuring one of them, while the other method would be to first split 900x900 image in 9 subsets (3x3 pattern) and then using sub sets (0,0), (0,1), (1,0) and (1,1) to do weighted summation. These should produce two identical image results (which could be verified by subtracting them and looking at the difference - which should be precisely 0 filled image if two are the same) - and in no way they should have different standard deviation. By examining difference I was hoping to get the idea what might be happening.
I started off by generating 900x900 gaussian noise image and I did x1.5 bin on it. To verify that it produces x2 SNR improvement I ran the stats on it and - Result was stddev of 0.555!
That is not the same thing that happened before! I repeated the test with another size just to make sure, and yes - again result of stddev was 0.555. How on earth did I get stddev of 0.5 last time I tried this?
Then I remembered my hypothesis about cyclic nature of random generator and sure enough, I remembered that I used 512x512 test image in previous case where I had stddev of 0.5. So I tried it again - result was also 0.5
- then I realized important fact - 512 side image aligns rather well with 16bit value (a WORD in computing terms), but also with 32bit value. In case that PRND is using base 16 or base 32bits - it could lead to cycling and values would not be acting as true random noise.
To repeat the findings, here are measurements of: 100x100, 200x200, 256x256 (again base 2 - 16 bit result), 400x400, 512x512, 800x800 and 1024x1024 all being binned x1.5 and measured for noise:
Not quite what I expected, but I think it will bring me closer to solution
100, 400 and 1024 sides "bin properly", while 200, 512 and 800 - don't. 900 side also bins properly.
It looks like those images that have side that has reminder of 2 when divided by 3 return wrong result. This points to implementation error rather than PRND issue I described above.
Issue solved! It is due to "feature" of algorithm that I implemented that tests show this behavior. Because binned result will not always match original sides I implemented "offset" which I totally forgot about
If for example we want to bin 7 pixels by x1.5, resulting image can have 4 pixels. One way it can be done is to use pixels 1,2,3 to produce first two pixels of output, and pixels 4,5,6 to produce next two and disregarding pixel 7 as extra. Or one could choose not to start at pixel boundary but half way "between" (starting at 1/3 of first pixel and finishing at 2/3 of last pixel) so that binned image is more centered on original image and no pixels are wasted
.
It also means that above reasoning with aligned pixels is only viable in some cases while not in other (where there is that offset).
-
2
-
-
I've seen this effect number of times before and still have not figured out why it is happening. I know it is related to read noise - but not sure in which way.
You say that each of your subs on its own is fine when stretched?
How about aligned subs before stacking, do they show the pattern? It could be that this pattern is created from read noise by alignment process (if bilinear interpolation is used or something like that)?
-
17 minutes ago, sharkmelley said:
If the fractionally binned image is split into 4 sub-images then you're right in saying that there is no correlation between them. I'm seeing the same standard deviation (on average) in each of the 4 sub-images as I do in the fractionally binned image.
Mark
That one really bugs me. I simply can't figure out the difference. When we do fractional binning and split image - this should happen:
We take only red squares (not perfectly aligned to edges - but it should be seen as taking whole top left pixel and respective areas of other 3 pixels). That is exactly the same as taking 4 subs and weighted adding them in 1:1/2:1/2:1/4 ratio. Yet two approaches differ in resulting standard deviation.
-
1 hour ago, sharkmelley said:
I'm very late to this thread but it looked interesting. Did you find your problem?
In any case I simulated this in a spreadsheet and found that 1.5x binning leads to a SNR reduction of 1.8x, which is what you expected.
I generated 10,000 groups of 9 random values. Each group of 9 values was binned down to 4 values using your algorithm. This created 10,000 groups of 4 values.
The SNR of the resulting 40,000 values was 1.8x lower than the SNR of the original 90,000 values.
Mark
No, I have not - I've done something similar to what you've done, only with images - created 4 images with gaussian noise and weighted added them in the same way one would create fractional binned pixel - and yes, that way it produces x1.8 SNR increase.
Still unable to figure out why there is x2 SNR increase once I fractionally bin and split result so there is no correlation between pixel values.


Wasted Night's Imaging? 4k Time lapse
in Imaging - Widefield, Special Events and Comets
Posted
Oh my, that meridian flip was fast