-
Posts
3,846 -
Joined
-
Last visited
-
Days Won
3
Content Type
Profiles
Forums
Gallery
Events
Blogs
Posts posted by CraigT82
-
-
Very nice shots, this latest generation of cameras are a real game changer
-
Ah I’m sure it’ll be fine to repeat what’s said on CN or even post links to it… just include an advisory warning that CN is a wilderness and should be navigated with care! 😂
-
6 minutes ago, neil phillips said:
Yes, your right it's been 11 years. But should be interesting. I will pm
Please post in this thread… I’m sure lots on here would be interested in a new Registax!
-
 1
1
-
-
Very nice, I like that a lot. Great resolution from the (relatively) little mak.
-
 1
1
-
-
That’s a beauty Neil, expertly processed… really well done 👍🏼
-
 1
1
-
-
Very nice image 👍🏼
-
 1
1
-
-
Those are fabulous captures, the subtle colour really brings them to life. As for sheer resolution I think you could still do better with the 8” newt. What is your sampling rate?
My best detail from the same class of scope (well, an 8.5” newt) is below and I think you could get close to this with your 8” in excellent seeing and correct sampling.
-
 5
5
-
-
29 minutes ago, Pixies said:
Does the ASI585MC camera need an IR cut filter?
Depends on what you’re using it for, but for general deep sky work I would use a UV/IR cut (I.e any luminance filter).
-
 1
1
-
-
Just need and OpenAstro tripod and pillar extension to go with it
-
QHY now getting in on the 585 game…
They’re also bringing out the QHY5iii200m which is highly sensitive in the UV and NIR (will be a great Venus imaging camera).
-
 1
1
-
-
Really nice capture Geof, nicely processed
-
 1
1
-
-
What a unique mount, Looks like it is driven via long belts around the two large round plates? What is the need for the tall ‘rats cage’ pillar? That looks like it might be a weak spot.
-
Lovely image. Hellas basin stands out like a sore thumb, don’t remember it being that colour last time. Maybe the recent storm deposited a load of fresh sand there.
-
Nice shot, lots of detail and definitely got potential. Seems like focus might have been off a tad? Maybe just seeing.
-
Nice! Your C8 is kicking backside
-
Nice shot, there’s a few ways to deal with the edge rind. Martin Lewis has done some fairly comprehensive work on what it is and how to get rid of it:
-
 1
1
-
 1
1
-
-
Nice image there m, shows even in poor conditions it’s worth going out. I’d be tempted to boost the saturation little to give it some zip
-
 1
1
-
 1
1
-
-
8 hours ago, vlaiv said:
It does look good - 2.06px/cycle is very close to 2px/cycle
Have you done F/ratio vs pixel size math on it to confirm sampling rate?
It might be that inner circle is actual data limit and outer circle is some sort of stacking artifact.
It is always guess a work.
Resulting MTF of the image is combination of telescope MTF and resulting seeing from all little seeing distortions combined when stacking subs. It will change whenever we change subs that went into stack - and we hope that they average out to something close to gaussian (math says that in limit - whatever seeing is, stacking will tend to gaussian shape), however, we don't know sigma/FWHM of that gaussian - and that is part of guess work.
Different algorithms approach this in different way.
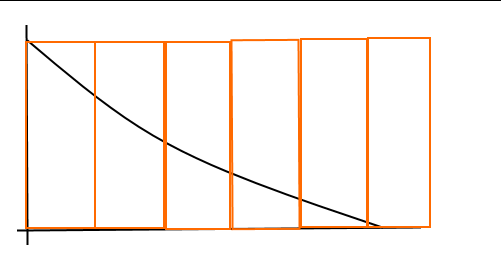
Wavelets do detail decomposition to several images. There is Gimp plugin that does this - it decomposes image into several layers, each layer containing image composed out of set of frequencies.
In the graph, it would look something like this (theoretical exact case, but I don't think wavelets manage to decompose perfectly)
So we get 6 images - each consisting out of certain set of frequencies.
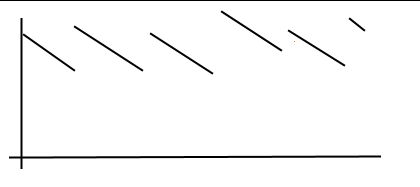
Then when you sharpen - or move slider in registax - you multiply that segment with some constant - and you aim to get that constant just right and you end up with something like this:
(each part of original curve is raised back to some position - hopefully close to where it should be) - more layer there is, better restoration or closer to original curve.
This is just simplified explanation - curves don't really look straight. For example in Gaussian wavelets, decomposition is done with gaussian kernel, so those boxes actually look something like this:
(yes, those squiggly lines are supposed to be gaussian bell shapes
 ).
).
Deconvolution on the other hand handles things differently. In fact - there is no single deconvolution algorithm, and basic deconvolution (which might probably be the best for this application) is just simply division.
There is mathematical relationship between spatial and frequency domain that says that convolution in one domain is multiplication in other domain (and vice verse).
So convolution in spatial domain is multiplication in frequency domain, and therefore - one could simply generate above curve with some means and use it to divide Fourier transform (inverse of multiplication) and then do inverse Fourier transform.
Other deconvolution algorithms try to deal with problem in spatial domain. They examine PSF and try to reconstruct image based on blurred image and guessed PSF - they solve the question - what would image need to look like if it was blurred by this to produce this result. Often they use probability approach because of nature of random noise that is involved in the process. They ask a question - what image has the highest probability of being a solution, given these starting conditions - and then use clever math equations to solve that.
Thanks! I’m not going to pretend I understood much of that but it’s given me some direction for further reading. Thanks for taking the time to respond 😊
I have looked at the planet size in the image and back calculated to FR and it came out to F/17, so I thought I was actually oversampled with my 2.9um pixels.
-
34 minutes ago, vlaiv said:
You did not manage to restore all frequencies properly but there was "gap" left in there. Not your fault - it is just the settings that you applied when sharpening that resulted in such restoration.
Thanks Vlaiv, super informative as ever.
The individual stacked tiffs were all sharpened with wavelets and deconvolution before going into WJ…. And I guessed at the kernel size during the deconvolution step exactly like you said.
Any ideas how I could properly restore all frequencies?!
Sampling looks ok though does it? I’m not sure.
-
Really nice result Neil, lovely detail
-
Very nice Mike, tough to beat sheer aperture on the moon
-
Had a go using the normal FFT function and got this (loaded up my winjupos derotation output OSC with no further post processing/sharpening). Edge of circle is 2.06 pix per cycle.
Does this look right @vlaiv. Seems to be a large concentration of low frequencies

If I try the same thing on the fully post processed image (no rescaling occured) I get this weirdness

-
-
That mosaic is a real beaut, the different mineralogy of the Aristarchus plateau is plain to see.
-
 1
1
-


Head Torch Recommendations?
in Discussions - Scopes / Whole setups
Posted
The Alpkit head torches are great, good bang for you buck.