


Bajastro
-
Posts
51 -
Joined
-
Last visited
Content Type
Profiles
Forums
Gallery
Events
Blogs
Posts posted by Bajastro
-
-
My souvenir photo of this supernova from the night of May 22/23, the supernova has a bluish color.
APM APO107/700, planetary camera ASI585MC with 2" Baader L filter, 160x60s.
Processing in Gimp, slightly cropped edges, reduced size up to 50%.
-
 4
4
-
-
My photo of the northern lights before midnight UT on Thursday from central Poland (latitude 51.9 N).
It doesn't seem spectacular due to the distance, but it's my first aurora borealis.
It broke through the layer of clouds, I always have clouds when there is something interesting in the sky.
-
7
-
-
I have both Interstellarum and Uranometria.
I recommend having both, but for the preparation of visual observations, Interstellarum Deep Sky Atlas is better because of the grouping of objects that are visible in the 4", 8" and 12" telescope.
Although I do not hide many objects described as visible in the 8" can be seen at low magnification also in a very good APO 4", such as a Pickering Triangle (part of Veil) with UHC filter of course.-
 1
1
-
-
My collection of Nova Cas 2021 spectral observations:
Spectral lines identification based on:
https://arxiv.org/ftp/arxiv/papers/1208/1208.0380.pdf-
1
-
-
My spectrum captured yesterday evening (20-03-2020 about 19 UT), stack 20x120s:
Equipment: SCT C8 F/10, LOWSPEC with 300 l/mm diffraction grating, slit 40 um, QHY163M, HEQ5 mount.
Determined expansion velocity is 1600 km/s.
Is my spectrum good enough to send to e.g. A.R.A.S Spectral Data Base?
-
6
-
-
The signaling LED has been powered together with the RELCO spectral lamp.
Electronics inside:
This device is powered by 230V, 2x47k Ohm resistors reducing the current intensity are in the plug from the cable.
-
Yesterday I analysed a material containing almost 100 movies.
89 stacks were available for further processing. Movies were recorded on 27th of October 2020 from 20:40 to 22:27 UT.
Below are animations showing the movement of Mars' moons:Phobos moves in an arc on the right, Deimos moves away from Mars on the left.
On the right, Mars is "approaching" the star 2MASS J01051472+0444422 (Gaia EDR3 2552047650065811968) with a magnitude of V= 13.2 mag,
and actually Mars is moving retrograde against the background of the stars
Equipment: SCT C8", kamera ZWO ASI 120MM Mini, ES Barlow 2x, GSO dark red (#29), all on HEQ5 mount.
-
2
-
-
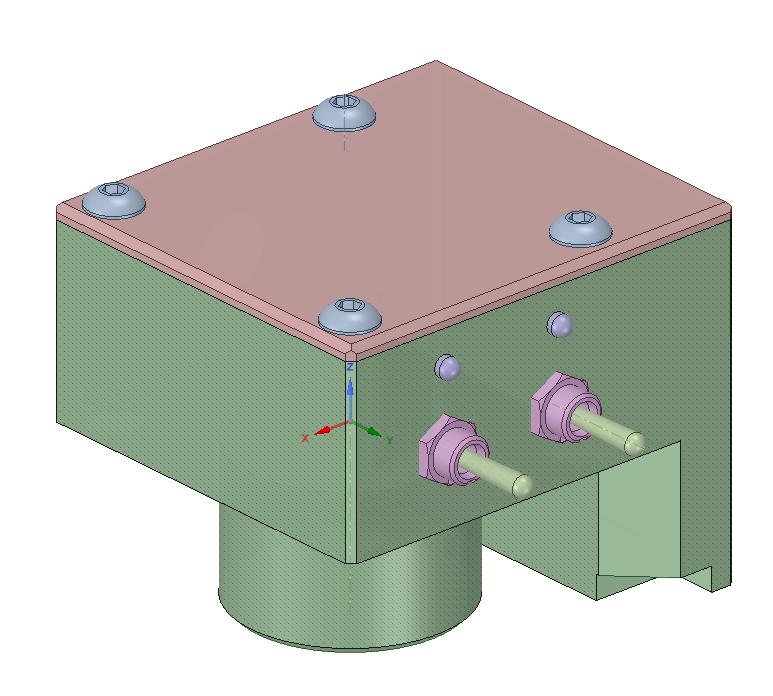
More than a year has passed since the construction of the Low Spec spectrograph in version 2.0 provided by the author of the project (@Paul Gerlach).
The project provided for the purchase of a ready-made module for illumination of the slit.From the beginning, I missed a decent calibration module and slit illumination.
But why buy something for almost PLN 100, when you can illuminate the slit while building a spectrum calibration module and add additional functionality.
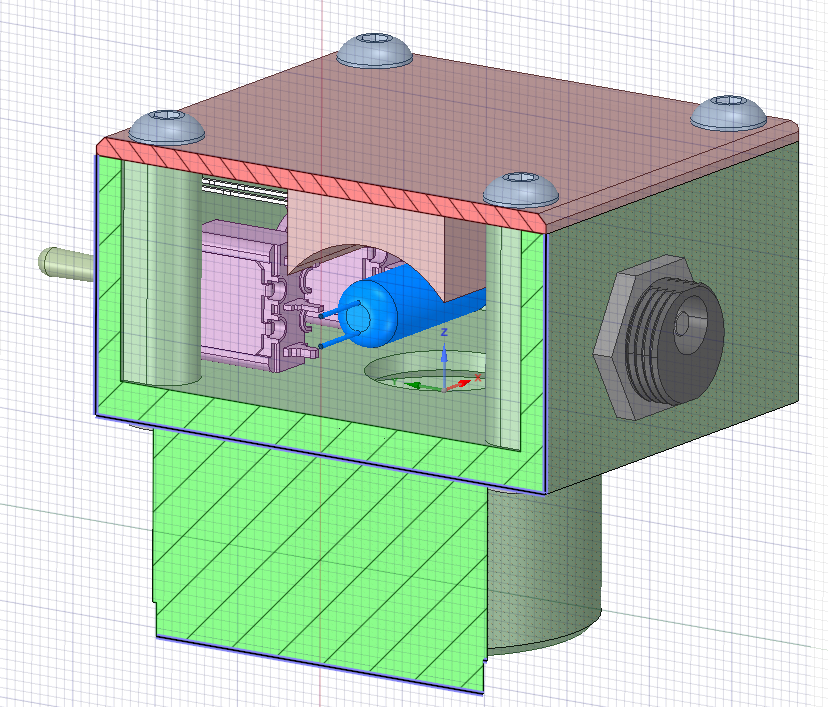
Everything is great on the "project":Inside the device:
But the electrical diagram I drew was not correct (I don't know anything about it at the time).
Not everything worked, so the modifications during soldering and compromises started: D, after a few attempts with soldering and desoldering, my calibration module finally works as it should.It was important for me that the calibration standard should be stationary (not moving), and this of the available components on the market only provides an imaging flip mirror with a tilting mirror.
It is sold under various brands with T2 threads, so it has a lot of possibilities for mounting various accessories and I made the right module for it.
No store in Poland undertook to order it, so I had to buy it on my own (UK).RELCO 480 starter spectral lamp:
The cylindrical mirror is a piece of aluminum foil stuck to it for packing sandwiches
Slit illumination also works:
Finally, only one LED informing that the slit illumination is on (the RELCO lamp with the diode on doesn't work).
Now it's time to put together the set:
Low Spec with 2 cameras and a calibration module is very big and heavy:
Solar line tests in diffused light on clouds:
RELCO 480 spectral lines have two values, the upper one is measured by calibrating the spectrum with solar lines, and the lower value is taken from
Richard Walker, CH-Rifferswil, 2017, Glow Starter RELCO SC480 Atlas of Emission Lines, available online: https://www.ursusmajor.ch/downloads/sques-relco-sc480-calibration-lines-5.0.pdf
The difference between my measurements and the data from the Echelle spectrograph from the above atlas is basically negligible, everywhere smaller than 0.2 Å, which means that on my scale it is below 1 pixel.
It seems that the construction of the calibration module was successful.The calibration module will facilitate a sufficiently accurate calibration of the spectra of faint stars without clear metal spectral lines and in regions where there are no atmospheric oxygen and water absorption lines used for accurate spectral calibration.
I had to capture pictures quickly because I have a drift on the diffraction grating holder (the spectra move over time).
Rather, it is loose, there is a micrometer screw and a spring, so the holder isn't very stable.I would to improve it next.
-
1
-
-
I choose several of the best my photos of Mars and I prepared an animation based on Łukasz Sujka's tutorial.
I struggled the most with map assembly in Gimp 2:I'm still waiting for good weather to photograph the area from Olympus Mons near the center of the planet's disc.
Animation prepared in WinJUPOS for the date 2020-10-13:
Equipment: Celestron C8 (SCT 8" F/10), ES Barlow 2x, Gso dark red filter (#29), ASI120MM Mini, HEQ5 mount.-
8
-
-
Mars is already slowly moving away from Earth, there is still a month of good visibility allowing you to observe many surface details.
I found some time and collected the best photos from among a dozen photo sessions devoted to Mars.
The planet was closest to Earth on the 6th of October.
-
7
-
-
Thank you all.
Last night after 3 cloudy weeks I photographed Mars with his moons:Moons: 100% from 60 seconds movie, frames 1s, high gain used.
Planet: 10% from 120 seconds movie.-
7
-
-
On 3-rd of September, just before sunset, I set up my equipment, aimed the telescope towards the zenith, set the spectrograph on the double sodium line and every now and then ran a series of photos, adjusting the exposure time (30-120 s) and gain. At the end it was so dark that the gain had to be increased almost to "what the factory gave".
I was not sure if we would be able to register anything at the resolution of 1800 l/mm holographic diffraction grating, slit with 40 μm wide. I also tracked the height (the depth of the sun below the horizon). I read in some publications that when the Sun is about 8° below the horizon, mesospheric sodium layer is in emission near the zenith above the observation site.
Two disappearing absorption lines and emission lines appearing in their place were recorded:
And an animation with the given position of the Sun relative to the horizon:
The capabilities of the printed in 3D technology my Low Spec spectrograph are amazing.
-
6
-
-
Mars was taken at night between 20:57 and 22:29 UTC. Equipment used: Celestron SCT C8, Barlow 2x, GSO #29 (dark red), ASI120MM Mini, HEQ5 mount.
Animation was prepared from 20 images with drizzle 150% (the best 10% of frames from 60-second movies):
One of the best images from 21:55UT:
-
20
-
-
Great result, Robin. Which telescope did you use?
-
Last night I recorded again the comet's head spectrum. NEOWISE has weakened significantly. There was a big change in 5 days. No sodium NaD emission. This comet is more green due to emission in the C2 Swan bands.
Comparison below:
-
5
-
-
Today after the midnight I recorded the spectrum of C/2020 F3 (Neowise). I couldn't change new diffraction grating (300 l/mm) before the midnight in my Low Spec 2 spectrograph. I have printed second unmodified mounting for grating and I had to use it, because dispersion angles are different than the 1800 l/mm diffraction grating. It was also necessary to assemble and run the setup. Not all lines were identified, the spectrum is different than spectra published on the internet. The violet range is worse due to the poor correction of chromatic aberration in achromatic lenses in my Low Spec and my APO, so lines are weaker. Intensity hasn't been corrected. I think that this comet was too low above the horizon to do it well. This is also the first light with a diffraction grating 300 l/mm used in the Low Spec 2.
Slit position, PHD2 screen:
Spectrum with stretched histogram, faint LP of my city is present in the background, 5x60s stack:
I hope that I correctly substracted LP from the comet spectrum.
The result obtained in the BASS software:
We have carbon C2 bands, CN and strong emission of sodium doublet. Some lines are unidentified yet.
-
12
-
-
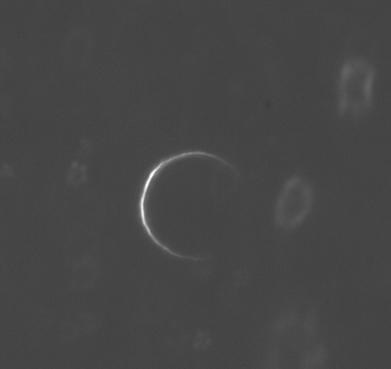
Venus in extremely phase observed 7 days ago.
Used equipment: APM APO 107/700, dark red filter GSO #29, Barlow ES 2x, ASI120MM mini on HEQ5 mount.30% best frames from 1 min movie:
Venus illumination was only 0.3%, angular diameter 57.6", angular elongation from Sun 4* 23'.
Unfortunately, in such conditions many shiny particles floating in the air were observed, for example:
-
13
-
-
@Jack Martin
I'm sorry for late answer. I don't have this book.
I use Bass Project 1.9.9 - version is marked on the right side on the each spectrum (light gray color). -
Few days ago I decided to observe the spectra around Na lines for Jupiter and Saturn. I had a little time and some problems with Bluetooth communication. It took me about 30 min.
About 3 am the sky was getting brighter. I set 20 μm slit of my Low Spec spectrograph along the equator:These images were taken few years ago.
1, 2, 3 - positions of spectral profiles
The goal was to record the impact of planetary rotation on the shape of spectral lines. Interestingly, the spectra contain not only the inclined lines created due to the Doppler effect.
There are also visible vertical absorption lines of the Earth's atmosphere, there are quite a few of them.
Below two stacks of Na doublet area, resize 200%:
Spectral profiles for Jupiter:
Spectraf profiles for Saturn Rings:
The result of calculations of the rotational velocity at the equator and comparison with data in the public literature:Result of calcutations Jupiter Saturn Rotational velocity 13.2 ± 1.3 km/s 10.5 ± 1.3 km/s Equatorial diameter 149890 km 128744 km Public literature Jupiter Saturn Rotational velocity 12.6 km/s 9.87 km/s Equatorial diameter 142984 km 120536 km The velocity of Saturn's rings is variable, the rings closest to the planet have the highest velocity, the furthest rings are the slowest.
The calculated average velocity based on the recorded spectrum is 15.8 km/s.
As an example, the velocity of the crumbs moving on the outside of the Cassini Break (ring A) is 17.5 km/s. Pretty close.
I took half a pixel as a measurement error.-
1
-
-
Thank you, the LowSpec capabilities are impressive.
The resolution is similar to SQUES Echelle spectrograph results.
I am still thinking about how to improve the guiding module in my spectrograph.-
1
-
-
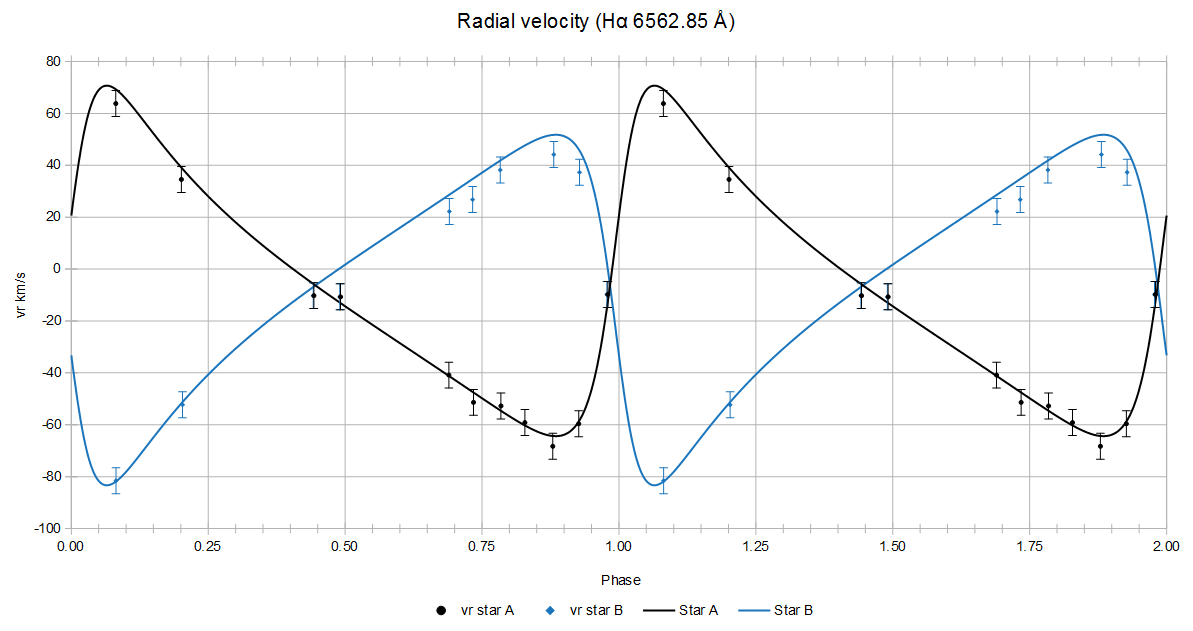
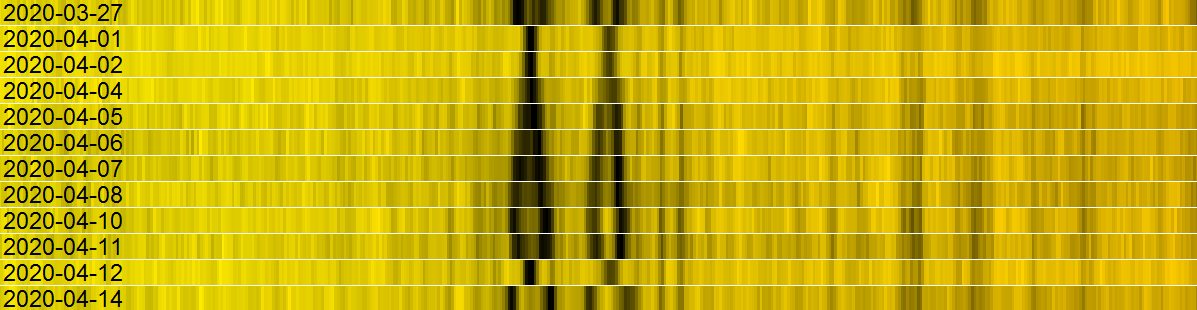
I finished observations of the Mizar A spectroscopic binary.
Calibration for the Hα line made on water lines contained in the Earth's atmosphere.
I used LowSpec spectrograph with 1800 grooves/mm reflective holographic grating, APM APO 107/700, QHY163M camera and HEQ5 mount with guiding.
It turned out that the Earth's movement practically compensated for the radial velocity of the Mizar A system.
Based on the analysis, I received the result:
vr = -8.8 km/s
in fact the system is approaching at a radial velocity of -6.3 km/s.
I also determined the phase plot of radial velocities based on my measurements for the Na (together for both lines) and separately for Hα line:
Error is based on half my spectral resolution (0.2 Å/pix corresponds to rv = 10 km/s). Each measurement corresponds to the stack a few images.
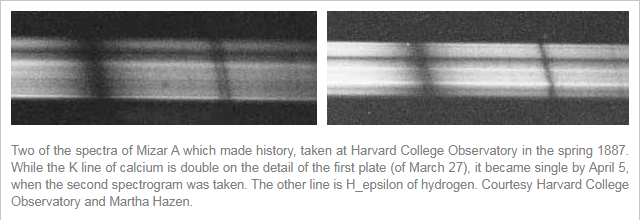
The most important purpose of observing this binary system was to record the historical Ca II line (often called as CaK, 3933.66 Å).
The distances in the violet part of the spectrum are almost 2x smaller than the corresponding shifts for the Hα line. This line initiated the discovery of spectroscopically binary systems, and Mizar A was the first discovered system of this type.
These were the spectroscopic observations in the 19th century:
Source: https://www.leosondra.cz/en/mizar/#b20
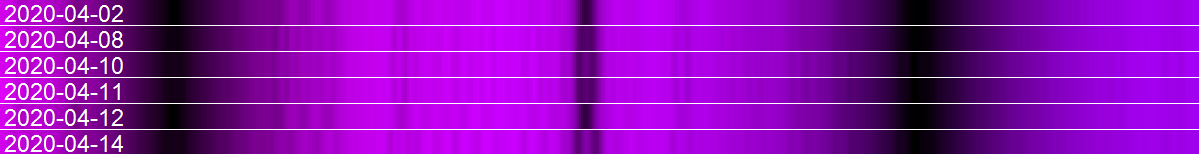
I've made several observations of this line in the last two weeks:
Animation showing the changes in the CaK line based on my observations:
Not only the Ca II is split, but the surrounding lines also, shown below in a wider environment:
Balmer hydrogen lines are becoming more dense as Balmer's gap approaches (3646 Å).
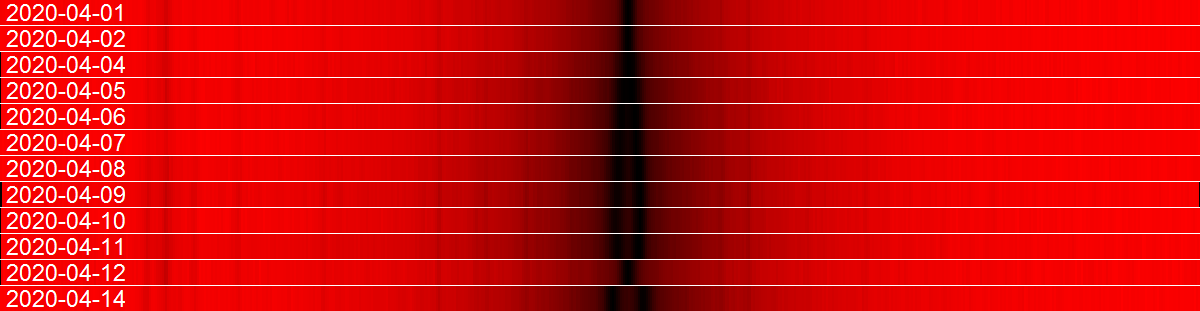
Observation result of the Hα line:
And animation showing the changes in this line:
The Na I doublet was much more difficult to observe, because stars with A spectral type contain very faint lines of this metal:
Animation showing the changes in the sodium doublet:
We received the sodium quartet-
9
-
-
Robin, which stars are the best for RV calibrations?
Last time, when I observed some H-alpha profiles in Be stars I used Capella spectra for wavelenght calibration. It isn't very good example, because this star is spectroscopic binary. No spectral lamp used. -
Thanks all.
I didn't use the calibration lamp. So, now I can only observe splitting of the spectral lines depending on the phase. In this case, movements of Solar System bodies were omitted.
But for better measurements precision of spectroscopic binaries with higher eccentricity orbits, I will need a good calibration module soon. My friend is constructing a calibration module for his LowSpec spectrograph. -
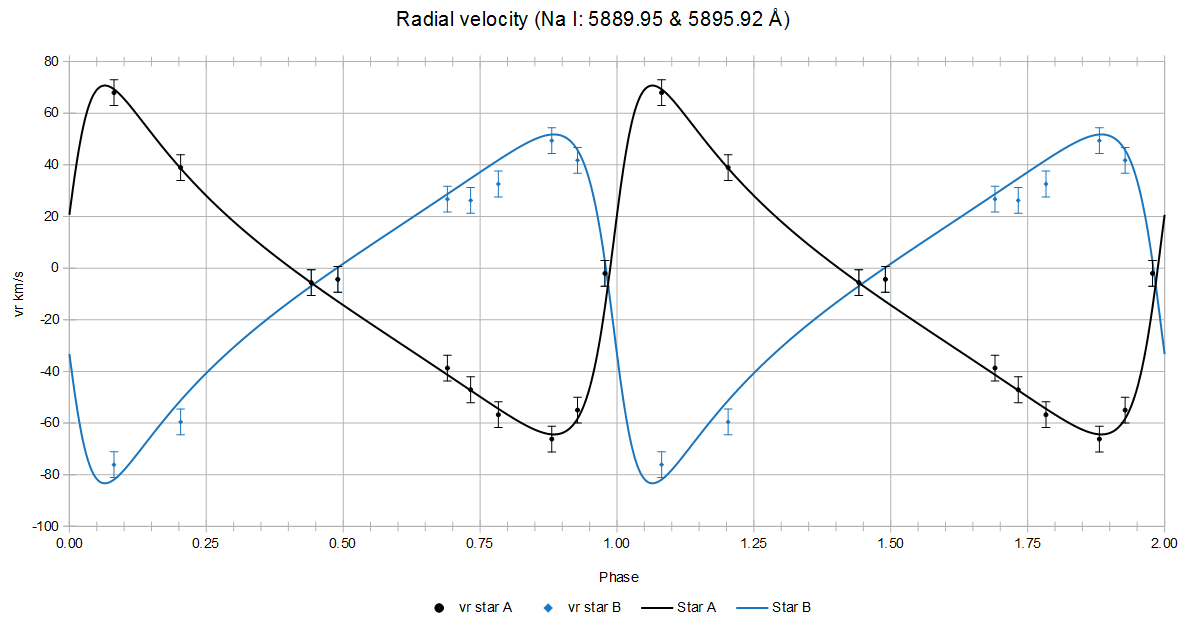
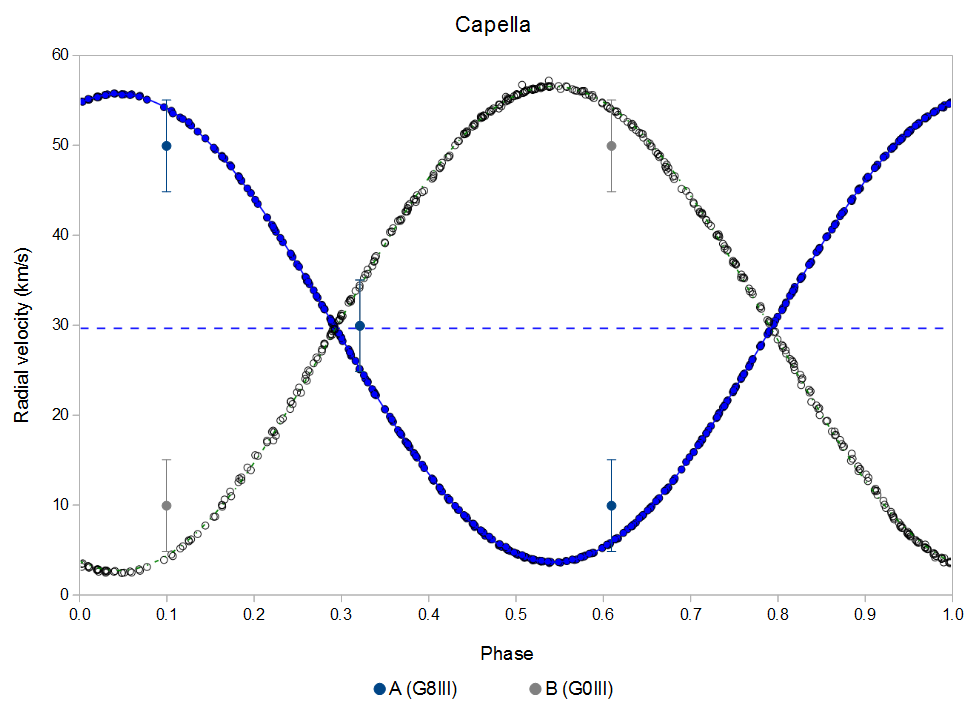
This system consists of two yellow giants having types G0III and G8III (some sources give K0III), similar masses and brightness. The orbital period of the components is 104 days.
The fact that one of the stars has a later spectral type is very convenient 😀. It has stronger spectral lines of metals, including sodium.
This allows you to immediately recognize which star is approaching and which is currently moving away.
I made 3 observations so far with using a DIY 3D printed LowSpec spectrograph in the version v2 designed by @Paul Gerlach and a 1800 l/mm holographic grating.
Based on these observations, the spectral spread for both observations for the sodium line is 0.79 Å (0.079 nm) or 4 pixels, which gives a difference of radial velocities of 40 km/s.
Assuming that component A belongs to G8III and component B to G0III:
2019-12-03 component A was moving at relative vr to the barycenter of the system of -20 km/s and component B was moving at a relative vr of +20 km/s.
2020-01-23 component A was moving at a relative vr of +20 km/s and component B was moving at a relative vr of -20 km/s.
I called radial speeds relative, because the radial velocity of the Capella barycenter to the Solar System wasn't included.
I took the radial velocity of the Capella barycenter into account and I received this phase plot:
The background is the plot of radial velocities from paper:
M. Weber, K. G. Strassmeier, 2011, The spectroscopic orbit of Capella revisited
-
6
-


My Jupiter from central Poland
in Imaging - Planetary
Posted
The night of September 16, 2023 was also the first light from SCT C11 XLT, a different telescope requiring a new approach, different requirements, new problems.
A much more demanding telescope than the SCT C8. Not every frame turned out sharp.
Barlow 2x, UV/IR Cut filter, ZWO ASI 585MC, 60s videos, 25% of about 1800 frames, I chose some of the sharpest frames.
16 Sep 2023, 3:23 CEST (1:23 UT):
16 Sep 2023, 4:28 CEST (2:28 UT):
16 Sep 2023, 5:33 CEST (3:33 UT):
Animation of 38 frames, each 25% of 2-3k frames from September 16, 2023, 3:16 - 5:59 CEST:
Below are processed photos from next night (September 17, 2023).
The same equipment was used.
17 Sep 2023, 2:13 CEST (0:13 UT):
17 Sep 2023, 3:16 CEST (1:16 UT):
17 Sep 2023, 5:12 CEST (3:12 UT):
Animation from 2:12 - 5:44 CEST covering 3.5 hours of Jupiter's rotation, 60 frames, each 25% of 2-3k frames: