


vlaiv
-
Posts
13,027 -
Joined
-
Last visited
-
Days Won
11
Content Type
Profiles
Forums
Gallery
Events
Blogs
Posts posted by vlaiv
-
-
I would use 12mm plossl + barlow over 6mm plossl, but if I were to choose between 6mm eyepiece with decent eye relief - I always prefer less glass and simpler setup (no need to handle additional piece of equipment like barlow).
-
2 hours ago, Rodd said:
Ahh. I assumed all mounts track. I guess that’s not true.
Well they sort of do - but not all have motors - there are some that only have manual tracking - which is fine for visual use - where you correct and recenter target every so often
-
1 minute ago, tomato said:
I had a wider question in that that although we should of course operate the cameras at the optimum settings for deep sky imaging, do these changes make a visible difference to the final result, given the magnitude of the changes made to the raw data by modern processing techniques (e.g LP gradient removal, BXT, NXT etc.
I think I covered that as well, but just to make sure:
1. too much read noise can be seen in raw data, especially when you go for very faint stuff that is on border of detection.
Say you image with very cool camera and very slow system in very dark skies. Then you need to expose for very long and difference between one minute subs vs something like half an hour subs - can be significant, particularly if you have camera with say 3-4e of read noise on lowest gain setting and you use that gain setting versus something more sensible + longer subs.
In general case - difference will be maybe too small to be noticed by eye but can certainly be measured. 10-20% higher total noise is barely noticeable by naked eye.
2. If you set your offset too low - that you will see as artifacts in stacking and very strange things at lower end of intensities close to noise floor.
Nothing can help there. In point 1 - you can simply image for longer to achieve better SNR and compensate for increase in noise from using sub optimal settings, but with this - you can't fix the data, so you better make sure you don't clip on the low side.
-
 1
1
-
 1
1
-
-
6 minutes ago, Stuart1971 said:
We were discussing the ideal gain and more importantly the offset settings of the QHY268 cameras…it seems that we have some people here that use 255 as the offset and others including QHY themselves, just use 30 for the same mode 0 setting, and wondered what effect this might have, and if you have an opinion…
Ah, ok.
If everything is ok with camera hardware (so no funny business on some gain / offset settings) - here is how it behaves and what you should use:
Gain - there are only few things that change with gain - that is read noise and full well capacity.
Neither is very important when stacking.
If you can't make longer exposures for some reason - then it pays off to reduce read noise (increase gain), but you should always look to optimize your sub duration depending on read noise - swamp read noise with some other noise source like LP noise or thermal noise.
People love larger full well capacity - because less stars will saturate in the image, but simply put - you will always have stars that are bright enough that will saturate and this is handled in a different way. If you have star or parts of very bright target that saturates in your exposure (regardless of full well capacity) - you simply make few short exposures that won't saturate those parts - and then use signal from those images in places where you have saturation in regular stack. It is sort of HDR composing of the data.
I personally like unity gain with most cameras as it has good balance of read noise and FWC (and removes some minor quantization issues), but some camera models - that is not best option as unit gain is in high read noise part of graph - so slightly higher value is then recommended - like with ASI533 where it is not very clear where low read noise kicks in and people often use 101 instead of 100 that is marked as unity gain.
As far as offset goes - too high is fine, too low is not.
Too high will simply just rob you of some FWC - but like we've seen above - FWC is not that important and main drawback of FWC - which is saturation of pixels is dealt with differently (by using few shorter subs).
However, too low can really mess up your data as it creates different kind of clipping - not at high signal but at low signal.
There is simple method to determine if you have your offset set correctly:
- shoot some number of bias subs (say 16 or so)
- stack those bias subs with minimum method
- do statistics on resulting stack and see what is the minimum pixel value
- if minimum pixel value is 0 or generally smallest number that camera reports (maybe some cameras will report some other number as lowest number - I don't think I've seen that yet, but in principle it is possible) - raise offset a bit and repeat procedure.
If you don't want to do this measurement - just raise it enough to be safe (like people do when the push it to the max).
-
1
-
1
-
-
1 hour ago, dan_adi said:
I'm thinking of trying the other way around for fun, simulate the spectrum, then search the V band mag in Simbad, then scale the spectrum to that magnitude, then make a synthetic observation with the V filter and see if I get the same magnitude as Simbad. Scaling to the magnitude would basically underline your idea about brightness
If you scale against V and measure V - you will get the same value.
Here is what you can do as an exercise:
- find a star in catalog with known V and B magnitude, then use Gaia dataset to find effective temperature of that star - not one from color index.
- generate spectrum according to that temperature
- scale spectrum based on V mangnitude
- measure B magnitude and compare to catalog value of B and compare your B-V index to Gaia effective temperature
41 minutes ago, dan_adi said:So that means the color index only provides information about temperature, but not brightness. Makes sense distance is a factor in brightness, besides temperature.
Well, if you think about what color index actually represents - you will have a better understanding of why it only corresponds to temperature.
Color index is difference of two magnitudes. Magnitudes are log based, and we know that if we have ratio of two quantities - corresponding thing in "log space" is difference. ( * and / turn to + and - in log).
What this really means it that color index is ratio of two intensities - intensity in V band and intensity in B band - turned into magnitude / log system.
If we have certain star and we increase it's apparent brightness by say making it closer - its intensity will change - maybe it will double - but that means that both V band intensity will double and B band intensity will double. However - ratio of these two values won't change as 2*V/2*B = V/B. Color index of a star does not change with its apparent brightness. It only contains ratio of different band intensities.
Since this ratio varies with temperature as black body curve is different - color index represents temperature of the star in a nutshell.
-
7 minutes ago, dan_adi said:
Given the difference I assumed I am actually computing instrumental mags, and I need a zero point for conversion to calibrated mags.
Ok, I get what you are doing, but here are some points to think about.
sp = SourceSpectrum(BlackBodyNorm1D, temperature=bv.bv2T(0.60))
What sort of intensity does this function return?
Imagine you have two stars - both have the same temperature and ideal black body spectrum. Both are exactly the same - but one of them is at half the distance of the other with respect to us.
You record those two spectra - and they will have exact same shape - except one of them will be x4 "stronger" than the other - simply because star is closer to us and consequently appears brighter.
You don't have means to specify "brightness" of the spectrum in this method.
Similarly:
wave = sp.waveset
flux = sp(wave).to(u.erg / u.s / u.angstrom/u.cm**2,equivalencies=u.spectral_density(wave))
I don't see how you tell the function how to calculate physical flux - is it "stronger" or "weaker" of two spectra? Flux should be x4 as high numerically for same values between the two - but if we don't have that information in SP and you did not use any parameter to explain how to convert to flux - flux simply does not contain "true" values here.
In the end - integrated flux will be some number that will correspond to some magnitude - but that is simply because numerical values for flux are some arbitrary numbers and not true numbers for true star with some defined brightness.
It does not need to be a real star - but it has to have defined brightness and I don't see how that is defined.
-
3 hours ago, dan_adi said:
So basically what is the process to get the mags from an observed spectra?
So you have a spectrum of the star and you want to calculate magnitude in particular band?
You are probably short of a multiplicative constant. You need to calibrate your instrument to be able to get precise magnitudes - and in this case it is multiplicative calibration.
Determining V band intensity from spectrum is fairly straight forward - you take spectrum and you multiply with V filter response and you integrate the result.
V band filter response can be given in percent or rather 0-1 range - so it does not influence choice of units. Spectrum on the other hand needs to be scaled to appropriate values in units of interest and if it's not - you need to scale it, to find multiplicative constant for your system.
To do that - calibrate on a known star. Take a spectrum of star whose magnitude you know - do the same integration to find numerical constant and then apply this constant back in the case of star you are interested in.
It's really like regular photometry - you need to calibrate your instrument first.
-
I don't know if this qualifies as high quality one - but it is just 5.5mm thick:
I have it on my wide field setup - Samyang 85mm T1.5 lens + suitable adapter and ASI178mcc
-
1
-
-
I see that I've been mentioned, but can anyone point out to the actual piece of discussion that you want my opinion on?
-
2 minutes ago, PatrickO said:
I'm thinking of attaching my DSLR to a small guided telescope. Something like a Celestron Nexstar 4se.
That is very good option.
It's 4" maksutov telescope and it will have sharp optics and enough focal length. It also has tracking that is easy to use.
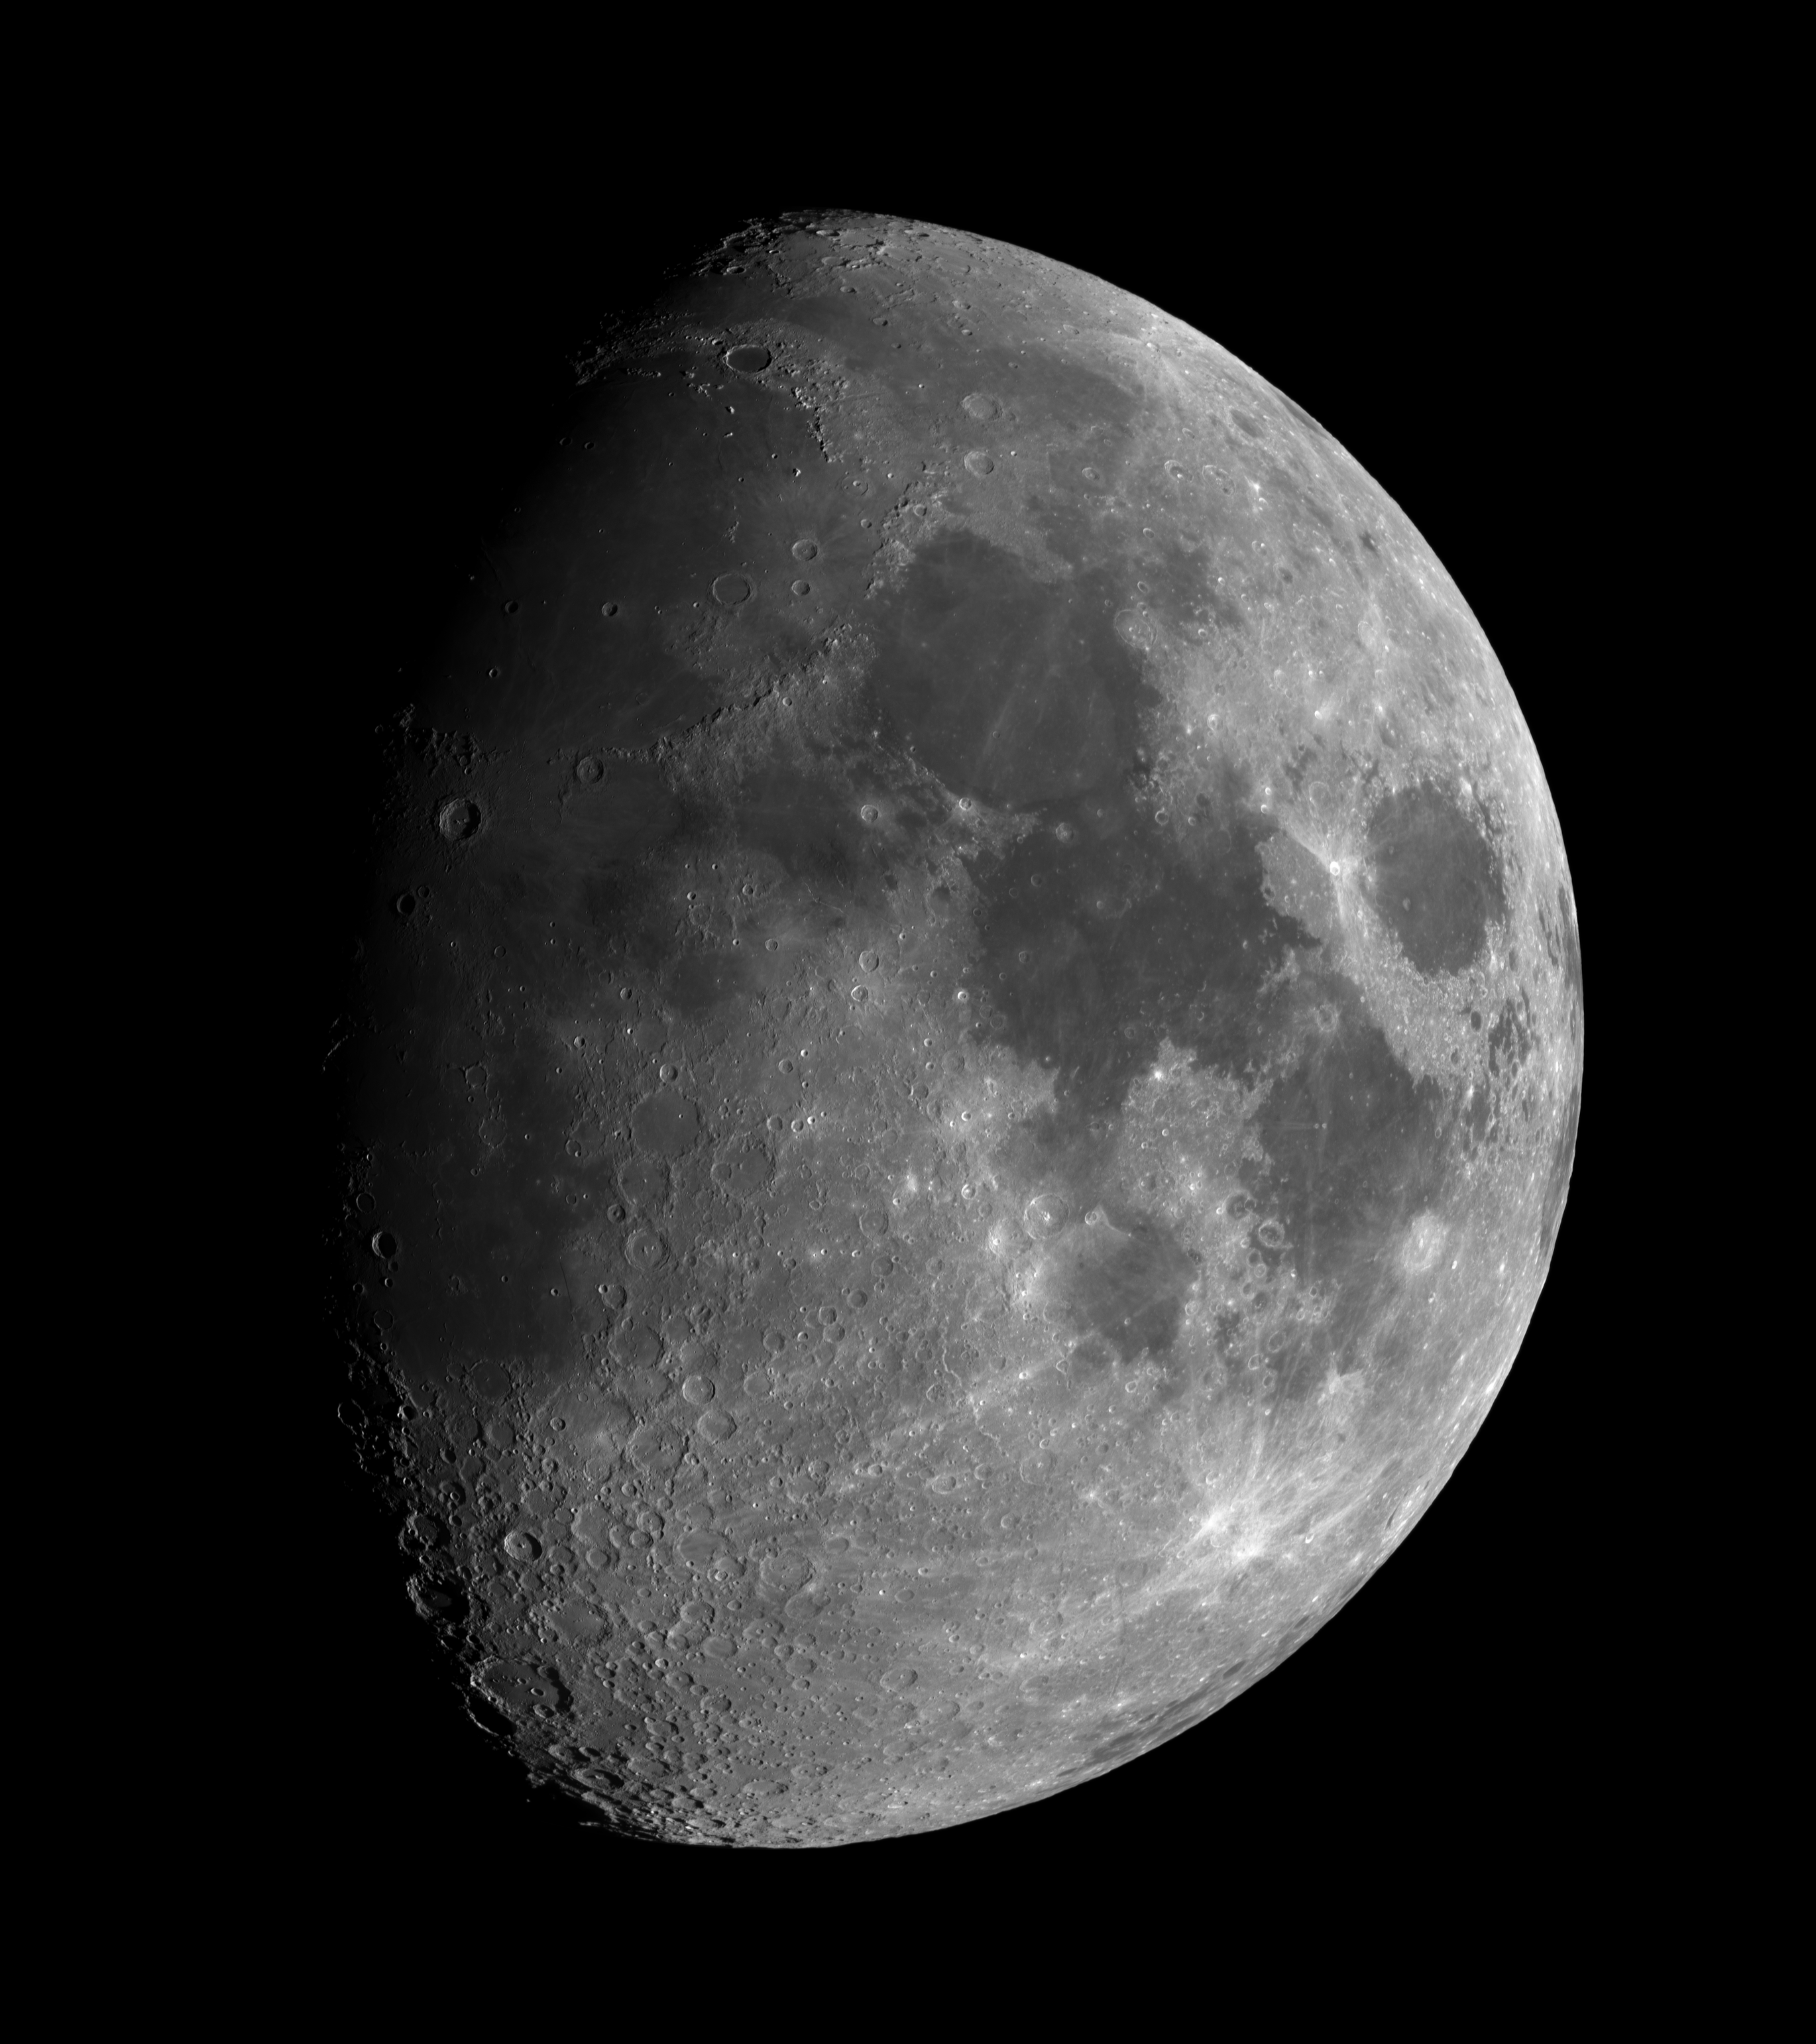
I've taken this lunar image with similar setup:

4" Maksutov and small alt-az mount. In this case SkyWatcher 102 Mak and AZGti.
Only difference was in camera used - I used ASI178 camera.
You can right click on the image to open it in new window so you can zoom in fully. Above image is mosaic composed out of I believe 9 individual panes.
-
3
-
-
4 hours ago, 900SL said:
Simply, yes. At longer focal lengths you will get movement blur when shooting video unless you crank the gain right up and shoot at high frame rates.
The moon is surprisingly fast if shooting untracked at higher focal lengths. It's also difficult to target and get in frame
No, not really.
Sidereal rate is about 15"/s and lunar tracking rate is very similar - just lightly off of that. For the sake of argument, we can go with this value without any issues.
Most planetary imaging is done with exposure length of about 5ms - but lunar can be done with even smaller exposures because moon is so bright - so say 2-3ms.
That is ~1/300th of a second (1/200th for 5ms exposure). 15"/s divided with 300 gives 0.05".
Moon therefore moves 0.05" in duration of single lunar exposure. Critical sampling rate for say 8" telescope is 0.41"/px - so moon moves 1/8th of a pixel during single exposure.
That is really not much motion blur to speak of.
-
1
-
-
In principle yes, but I would advise against it.
You can record a movie while letting the moon drift thru the FOV and then using surface stabilization feature to try to do "a strip" of lunar surface. You can do multiple strips and stitch them together into mosaic (many people do full disc mosaics so that is something that can be done without too much trouble).
While it can be done - I think it is too much work and requires certain skill. If you want the challenge - then sure, but if you just want to get result, tracking is much better option.
-
1
-
-
4 minutes ago, GasGiant said:
If I took a one minute video of the moon with NO tracking would software auto juggle the best frames and stack them. Or, as I suspect, it would not as the moon would drift too far away
I've seen people do incredible things with manual tracking dobs for example - so it is possible.
Moon is actually very good target to try to capture as it is big and drifts thru FOV - which means that you always capture some part of it. Then you can do what most people do and create lunar mosaic - from each movie of the moon focus on one part of its surface and stack that (there are different ways to "stabilize" the recording and surface features is one of those methods - and I think it will work well for this use case).
Then you can take the same movie and focus on different part of lunar surface and stack that.
In the end you take different panes and stitch those into mosaic of lunar surface.
Doing good lunar image without tracking is not going to be the easiest thing - but I think it is well possible.
-
It all comes down to timescale of particular changes.
In planetary imaging exposures are set so that our atmosphere does not move in this time frame (our atmosphere is "wobbly" and distorts image). Total exposure time is limited to avoid artifact from change on particular target. Some targets change over long periods of time and some on shorter scales.
Stacking software is able to compensate some level of change, but for other things there is dedicated software.
For example - stacking software is perfectly capable of compensating for change in apparent size of the moon during the course of the evening. Moon changes in size because earth rotates and observer is sometimes closer and sometimes further away from the moon (earth's radius is ~6300 Km and distance to the moon is ~384400Km so that is up to 1.6% change in apparent size between moon rise and it being at zenith).
Stacking software is capable of compensating for Jupiter's rotation up to few minutes, but longer than that and you need to use dedicated software.
In any case - exposure duration is order of milliseconds and total recording often ends up being several dozen of thousand of frames - so up to few minutes of recording. If change is longer than this time frame - there is no issue, but if it's shorter - well, shorter imaging run must be used.
-
1
-
-
2 hours ago, Ags said:
@vlaiv i was doing a simple "maximum" stack. I wonder if my random noise got corrupted by debayering, which I thought I had disabled?
Maximum will produce similar effect as it will pick up maximum pixel values when electrons spill into potential well.
-
Are you leaving the hobby completely?
-
11 hours ago, Ags said:
I will try figure out why my hot pixels look funny.
Is that a single sub or stack, and if it's a stack - what type of stacking did you use?
CMOS sensors have this very interesting noise pattern that is not obvious at first glance.
It is type of random electron leak which happens on junction between pixels and sometimes leaks into one pixel and sometimes into adjacent one. When you examine subs in sequence - it looks like these pixels are blinking and this type of noise is often named telegraph type noise because of this.
If you however use stacking and use standard deviation as stacking method - these pixels will lit up because there is much higher uncertainty in their value / larger standard deviation spread because of this telegraph type behavior. They are like hot pixels - but randomly hot and not always.
On my ASI1600, I get them in very distinct way - always a group of 2 pixels and always in diagonal direction:
This is standard deviation stack of 64 one minute darks (random crop from a part of sensor).
Here is animation to get the idea why it's called telegraph type noise:
-
11 minutes ago, Mandy D said:
What you have actually done is to mix white (which is 33% red, 33% green and 33% blue) with an additional 50% red, because the white is a balanced mix of red, green and blue. You cannot carry out your analysis in the way you are attempting to. White does not have a solitary wavelength associated with it, whereas red, blue and green can and do.
Things are even more complicated than that.
White is not color of light - there is no white light. White is construct of our mind. Our brain selects what it thinks is best suited to be white at any particular time.
Light that we perceive as white in one set of conditions can seem to be yellowish white under different circumstances and even bluish white under yet another conditions.
That is why we talk about "white points" rather than white light when we discuss color spaces. It is light that is most likely to be perceived as white under set of conditions that color space is designed for.
Similarly - there are not red, green and blue colors. I mean, there obviously are such color - but unless you specify color more correctly - you are very ambiguous of what color you are actually talking about.
When you say that white is 33% blue - which blue are you exactly talking about:
Here is a neat trick by the way, I'm going to repeat above graph:
Provided that I marked Pink correctly (I'm a male and as such take no responsibility in naming colors correctly
 ), It can be produced by either taking Orange and Blue (marked with arrows) or Green and Some strange color between red and blue that looks like Pink but is much more saturated in certain ratios.
Like I explained - any color on above diagram can be produced with any other colors (we are talking about light and mixing of the light of certain spectra) provided that wanted color lies inside convex hull created by vertices of other colors that we use to generate it.
There is nothing inherently special in "red", "green" and "blue". We can do the same with Teal, Orange and that saturated color between red and blue that looks like Pink
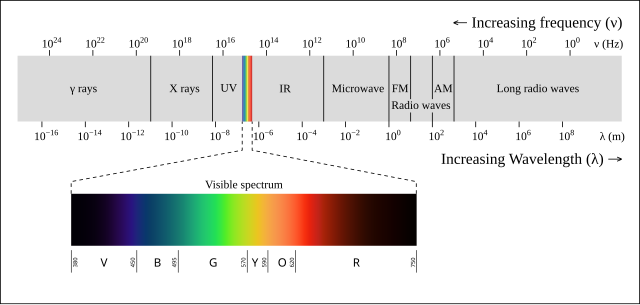
Well, in fact - there is something a bit special with red, green and blue - it turns out that most of color gamut can be covered with correct choice of blue like color, red like color and green like color:
Here is wide gamut RGB color space defined by CIE - it uses 700nm, 525nm and 450nm pure spectral lines as "R", "G" and "B" components - and thus is able to produce most visible colors - with only three wavelengths!
-
5 minutes ago, wimvb said:
Mind you, this was done with a CD spectrograph and a mobile phone camera in classroom lighting (overhead LED lamps) during day time.
Well, any sort of spectrograph is a good idea, but one must be careful when speaking about pure spectral colors in terms of capture and rendition.
We can't properly capture pure spectral colors with our cameras, and we can't properly display pure spectral colors with our computer screens.
Almost al spectral colors are outside of gamut of almost all capture and recording devices.
Mind you, this does not mean that we can't isolate particular wavelength with filters as we do in Ha/Hb/OIII, SII and similar (although fact that our targets emit individual wavelengths helps with this as filters are not quite narrowband although we call them that - think of Solar Ha that passes 1/100th bandwidth of what ordinary Ha filter passes).
In principle, we could capture spectral colors properly if we had sensor that has response that maps 1:1 to XYZ color space. Most sensors lack this capability.
Similarly, in order to have display that can reproduce all pure spectral colors - we would need to have display that can create any sort of spectrum in its pixels - which we now don't have.
As far as rendering spectrum goes - we need to resort to a trick. We know how to "generate" signal that represents pure spectral color (in XYZ color space), however, since our screens can't reproduce it - we need to do perceptual matching and select color that our display can produce that is closest in resemblance to what we would see with our eyes.
Interestingly enough - although we can't display individual spectral lines - we can display some combinations of them (but not all).
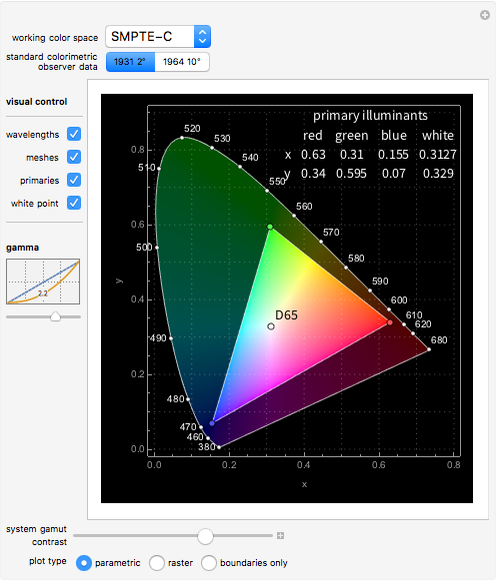
Here we have "space of visible colors" with sub space of colors that can be displayed on computer screen that can display sRGB color space (central triangle).
There is interesting property of light and our vision that goes like this: If you take any number of points on above diagram - you can generate any color inside convex hull bounded by said points just by using light with color described by those points. This is why our computer screens can display any color inside above marked triangle - because pixels are able to produce R, G and B light with particular coordinates in above diagram (you even have primary illuminants in top right corner with x and y coordinates of each).
Pure spectral colors lie on outer boundary of color space (they are marked by their wavelength).
All of this shows that - if you want to produce particular spectral color - you need to include its source in color mix as you can't produce any pure spectral color as mix of any other two light sources - whole color space is convex and you can't draw a line from any two points that crosses the boundary unless one of the edges of this line is said point on the boundary.
It also shows that you can display Ha/Hb color mix in some ratios (but not all) - since 656nm - to 486 line passes thru marked triangle and you can see what sort of colors such mix can produce - from red to purple, pink and blue. In fact - if we use "strict" way of producing colors - we can't have red version as line falls outside of triangle - but if we do above trick and select similar colors that do lie in triangle and are close on diagram (and more importantly visually) then we can get almost all combinations.
By the way - here is image of color spectrum produced with unknown (but I'm assuming incandescent light) source on gray background (which does tend to wash out colors a bit):
This is also a good capture (but again, we have some background):
-
2 hours ago, gorann said:
Maybe your discharge lamp also produces some more broadband light that is mixed in with the Ha. 656 nm is near the middle of the red part of the spectrum
That is not very accurate rendition of spectrum. Compare to this one:
Ha is very deep saturated red / dark red. You can always see what Ha light looks like by actually looking thru the Ha filter.
-
1
-
-
1 minute ago, Rodd said:
Out of luck. I checked and only have the registered SII subs and they all have the grid pattern.
I guess that process of registration caused SII subs to have grid pattern. You no longer have raws?
You can "cure" grid pattern by not trying to stretch so much. It is really just noise and if you can see it - you are hitting the noise floor. Pattern forms out of noise because some pixels get more averaged out than others and this improves their SNR. These pixels lie on rectangular grid - and after denoising - grid is shown as darker and lighter zones.
-
3 minutes ago, Rodd said:
All other channels were collected over the same time and my PA was the same. I typically register all subs to the same sub.
I guess that you don't cycle filters, but rather take some time to do the Ha, then OIII and in the end SII, not necessarily in that order?
Was this a single night?
In any case, depending where target is in the sky - slight PA error + guiding can lead to different levels of field rotation.
You can have PA error in altitude and/or azimuth - meaning your mount needs to be turned "left/right" to reach true NCP or it needs to be tilted "up/down", or some combination of these. Left/right error differs from Up/Down error in sense that it causes DEC drift in different part of the sky.
One is near meridian and other is when the mount is pointing east or west.
Depending where you are on "a circle", and depending how big your DEC error in that moment - guiding will cause more or less field rotation (field rotation is created when there is DEC drift and guide system compensates. In fact - I think that it would be there even without guiding, guiding just helps to stay on target).
In any case - if you shoot Ha in one part of the sky and SII in other - this can cause one set of subs to have very small field rotation and other to have somewhat bigger.
-
2 minutes ago, Rodd said:
Does it mean there was rotation of the camera or tube or some other part of the system?
No, it is due to field rotation because of slightly off polar alignment.
It can also be that your subs are all aligned but there is small rotation between channels so one of the channels needed to be aligned to others.
Try restacking - but use different reference frame.
-
What software are you using for stacking and what interpolation algorithms does it offer?
Above is artifact related to a small angle rotation when aligning subs and using certain forms of interpolation.


QHY268M & QHY268C Users Thread (Please share your knowledge and tips)
in Discussions - Cameras
Posted
Does not have to be the case.
There is glass window and glass is not 100% rigid (nor is aluminum casing for that matter, but it is far more rigid than glass window). It deforms under pressure - enough to be able to equalize pressure on the other side if difference is small (and volume vs surface area of glass is such that small bend in glass can cause enough change in volume).