


coatesg
-
Posts
820 -
Joined
-
Last visited
-
Days Won
1
Content Type
Profiles
Forums
Gallery
Events
Blogs
Posts posted by coatesg
-
-
Yes! This is much better - the core sits much better in the dust now - great job!
-
Double post...
-
1 hour ago, Rodd said:
yeah I am pretty familiar with it--but still learning the really delicate adjustments. There is a tool called statistics that you are supposed to use (according to the Light Vortex tutorial). The tool gives you teh standard deviation in exponential format and you put that number in Edge Control (second slider). But so far it has given me values to the -2 power, which is very aggressive (default is -3). So so far I have not been able to make it work the way the tutorial suggests.
No - that stats thing doesn't work for me either. I just land up playing with the edge protect setting until it is acting on the right scale of noise, and then adjusting smoothness and finally strength until it's just enough to do the job. Use of the image itself as local reference is helpful to target only the low SNR areas.
-
That's a beautiful rendition! 😎
-
 1
1
-
-
7 minutes ago, ollypenrice said:
I think lum is a good idea because you can harmlessly use NR on the colour beneath it.
Agree - I think this will definitely help drag the dust up. TGV in PI is very powerful - it takes a lot of playing around to get the right levels (do it on a preview first - it's much quicker) but it's surprisingly good, esp on the Lum noise - it can denoise the Luminance and colour independently as well.
-
Also, what's the split of data across the filters?
-
I think that brown is what people are generally used to, it's almost a conditioning to having seen other renditions.
Colour is such a tricky thing (especially when there's no true "right answer"). How did you colour balance the image out of interest - it it using a tool, or "by eye"?
-
Likewise, I think this is a good rendition. I'd agree on the dust to some extent - it's perhaps not so much dark but maybe a touch red to my eyes?
The core itself looks quite blue, but the pink highlights are present, so it really can't be completely off - it maybe is a little too contrasty for some, and it might just sit better in a slightly brighter dust surroundings?
Still, hyper critical - it's a good image!!
-
Fantastic detail - very nice indeed!
-
1
-
-
After a fairly long hiatus in imaging, it's good to be back doing AP again - the long break was partly due to working together with @Pompey Monkey (Paul) in getting everything together and installing a setup as a joint venture at EEYE in Spain. We completed the setup in mid September, and have been going through the usual teething issues in getting it running, not helped by having only one partly clear night out of the 4 we were there! I've been discovering bugs in SGP and in the Gemini 2 controller firmware along the way, but we're managing to tease data out of the system and work round issues that we have.
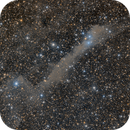
This is the first light from our setup there - LBN534 (Gal 110-13) is a large, faint dust cloud, extending for about 1.5 degrees across northern Andromeda. It looks like a large cosmic tick in this orientation. LBN534 contains the blue reflection nebula VdB 158, illuminated by HD222142, which is located towards the southern end of the nebula (north is to the left in this view). The tiny planetary nebula PN K 1-20 (PK 110-12 1 or PN G110.6-12.9) can be found lurking just to the south (right) of the nebula and is a beautiful deep blue-green colour (it's only 34 arcsec in diameter).
Lots more work to do as we go and it has been much harder than I envisaged to get to this point (not helped by bugs and snagging), and a lot of streamlining we can do, but amazing the hours we've already been able to do from what is a dark place indeed. (we maybe went a bit overboard with the data on this one, but first run and all that...)
Scope: Skywatcher Esprit 80ED with flattener
Camera: SBIG STF-8300 with Baader LRGB filters
Mount: MI-250 with Gemini-2
Exposure: LRGB = 18h : 3h20m : 3h40m : 3h20m (all in 10min subs - 28h20m total).
Image Capture: Graeme Coates & Paul Tribe
Processing: Graeme Coates (Pixinsight)Astrobin link: https://astrob.in/0okq1g/0/
Thanks for looking!

-
7
-
-
Very nice!
Depending on what your gain was (ie what the read noise was) you may not find any appreciable benefit from going from 300 to 600sec for an equivalent total exposure. As long as the background sky level swamps the read noise, then there's very little difference in the outcome, and you potentially avoid guiding issues at the expense of a larger volume of data.
-
The flat does have a gradient (well, asymmetry at least, especially towards the bottom right) - how are you making the flat? I mean, this could be fine if this is indeed how the optical train behaves, but, if it's not truly representative, then it may well be the issue (despite my earlier thoughts!).
Can you take one set of flats on one side of the pier, and then another the other side?
EDIT: Beaten to it 😉
-
OK - well I get the same discontinuity:
but I get it for both the variable, and also doing a check against a few of the comparison stars in the field against each other - but the discontinuity goes the other way in the stars I chose here (and it varies in magnitude according to the reference stars used):
There's something odd here in that for the variable, using one set of comparison stars, the discontinuity goes one way, whereas you've got it going the other way. I can't quite work out why this would be the case, but there's definitely something odd. Could you try doing single star comparisons against individual reference stars in the field perhaps (from the AAVSO sequences) - that might give a clue as to the scale and direction of the discontinuity when using different comparison stars over the image? Otherwise, I'm a bit stumped...
-
On 07/09/2019 at 10:03, james_screech said:
Thanks for the offer, the problem would be that the images files are about 40GB.
Just choose a few from either side of the discontinuity 😉 I'm sure it's not the flats, my guess is something mechanical impacting the stellar profile, bit needs image inspection to be sure.
-
If the plot is relative magnitudes between the reference and the eclipsing binary, then it shouldn't show a discotinuity like this around a flip, even with focuser light path intrusion.
I suspect, like Whirlwind says, there's some mirror flop/loss of focus/collimation that's adversely affecting the profile of the star. If the aperture settings are too tight for one or the other, then this might cause this kind of issue. It doesn't really matter about focus being absolutely bang on for photometry, as long as you have the aperture settings dialled in correctly in the photometry software. If you have some raw data, then I'd be happy to take a look and plot it out.
-
I go through a local broker - I can speak to them there and then to confirm all coverage and requirements (outbuildings, security, structure, etc), and they beat my previous insurance by some margin too.
-
How big and is the filter still taut (assuming it's a mylar film type filter?)? A small piece of opaque material (paper sticker, duct tape, etc) stuck over the hole would make the filter safe to use if it's a pinprick size hole, but beware of the filter suddenly splitting if the hole is larger and affects the structural integrity of the filter - this would be very dangerous if the filter was in use at the time.
-
Yes. V2 has better colour (there is a green cast in the top one), and is sharper. The core is much more natural in V2 - contrast in v1 is overdone IMHO.
The HA needs to be dialled back a little I think though, more like v1.
-
One thing to note here, is that the BAA/AAVSO sequence stars are chosen so that they are not variable (or at least shouldn't be!). if you're comparing against *all* field stars from Gaia, I think you need some kind of way of eliminating variables. Having lots of them helps in this regard, but some kind of check to ensure the quoted mag, and the ensemble check of comparison magnitude would be useful. A good check here i the V735Lyr set - it has V734Lyr in it - that varies substantially over the course of that dataset.
The BAA spreadsheet has something similar (but more by way of a quality check) by doing a calculation to ensure the magnitude from the data you're using comes out correct for the comparison stars in view.
-
Darn! I set the wrong filter for the 20s exposures - should have been R. Have cancelled and re-setup those... grr. I'll try and sort out a couple of datasets for you.
-
The catchy named star above, as well as CS Cas, is a W Virginis (Cepheid II with period>8 days) star - curve looks good - CS Cas is a bit atypical with the hump after maximum.
OV Lup is a Mira and has a period of about 2.5 months from memory. The exposures in each band should be consistent, unless I've mucked up the request... I'll take a look tomorrow...
AstroimageJ places centroids using Dec/RA coords - if you choose the right parameters, then having trailed stars doesn't matter too much, as long as the plate solve works!
-
Nice one
") Yes - the data on LCOG isn't always pretty, but tracking (and indeed focus) isn't critical for variable work as long as the relevant size circles are used in the analysis.
Yes - the data on LCOG isn't always pretty, but tracking (and indeed focus) isn't critical for variable work as long as the relevant size circles are used in the analysis.
There's a second variable in the 0735lyr set (it's 0734lyr). You might want to look at OV Lup - that's a Mira type sequence that I'm running and I haven't plotted yet and there's 3 bands available.
I have some sets of data from my own scope that happy to share as well - mostly HADS stars, but have a nice series showing two eclipses of an EB type eclipsing variable. Drop me a message if you'd like them.
-
53 minutes ago, han59 said:
With respect to timing an object in a stacked image, If the stacking program keeps a record of the start exposure times and fills the final stack with the correct earliest start exposure time and correct summed exposure time this "timing problem" should be no problem. I assume an equivalent solution would be to draw a trend through an abundant amount of measurements. All according the same principle noise reduces with more samples.
Just noted the time is geocentric. Is helio-centric not more used?
Stacking (and trends) - yes, correct, but if you're looking for changes of the order of a few minutes (eg cataclysmic variables), and stack up (eg) 10x2min exposures, you'll average it away... for faint targets, you have to choose between time-resolution and signal-noise...
JD vs HJD : correct, but both the BAA and AAVSO databases expect JD on submitted data so I just tend to present it like that. A researcher can always do the JD->HJD conversion themselves if they want to use the data. As long as it's clear which one it is...!
-
Well that's an option, but the advantage of everyone using the same references is that they can all be corrected computationally at a later date. Hence I tend to use the official APASS mags from the AAVSO sequences.
Either way, I suspect with ensemble reduction, it won't necessarily result in much less noisy data - my data is worse than Gaia always!


M51 to get us looking forward to galaxies!
in Imaging - Deep Sky
Posted
I'd agree - there's a super level of detail here, but just feel it's a touch bright and yellow.
The tidal tails are super though!