


robin_astro
-
Posts
1,209 -
Joined
-
Last visited
-
Days Won
1
Content Type
Profiles
Forums
Gallery
Events
Blogs
Posts posted by robin_astro
-
-
I think it might be worthwhile taking a step back here. There are several sources for the difference between the shape of the spectrum as measured and how it should look. The camera response is one of them and mono cameras certainly have a smoother response than colour cameras. There are other effects though including the response of the grating, the telescope optics and the earth's atmosphere so knowing the camera response is not enough. Fortunately a simple way to account for all these effects is by measuring a star that we know what the spectrum should look like and dividing our spectrum by the published spectrum. (We normally choose a hot eg A star as these have a simpler spectrum. If using the Star Analyser, this is typically the same one which is used to initially focus and wavelength calibrate the spectrum). This gives us the response of the whole system including the camera. We can then use this to correct the spectrum of any star. The process is the fundamentally the same whatever software you use. There are examples of doing this for both the Star Analyser and ALPY in my tutorials here
http://www.threehillsobservatory.co.uk/astro/spectroscopy_10.htm
and documents here
http://www.threehillsobservatory.co.uk/astro/spectroscopy_21.htm
Cheers
Robin
-
 1
1
-
-
The observation that really made me go "yes!" out loud though was, after weeks of planning, watching the ISS streak across in front of Jupiter in 2004.

-
9
-
-
14 minutes ago, Nigella Bryant said:
A total eclipse of the Sun in Turkey in 2006 with a group of other astronomers and the sky at night team right next to me.
I'll second that, particularly after missing out on totality in clear skies by a couple of minutes after driving across Europe in 1999. Are you in any of these photos I took in Kizilot by any chance?
http://www.threehillsobservatory.co.uk/astro/spectra_27b.htm
Robin
-
Hi Louise,
Christian Buil has a nice page which goes through the design of a classical spectrograph here
http://www.astrosurf.com/buil/us/stage/calcul/design_us.htm
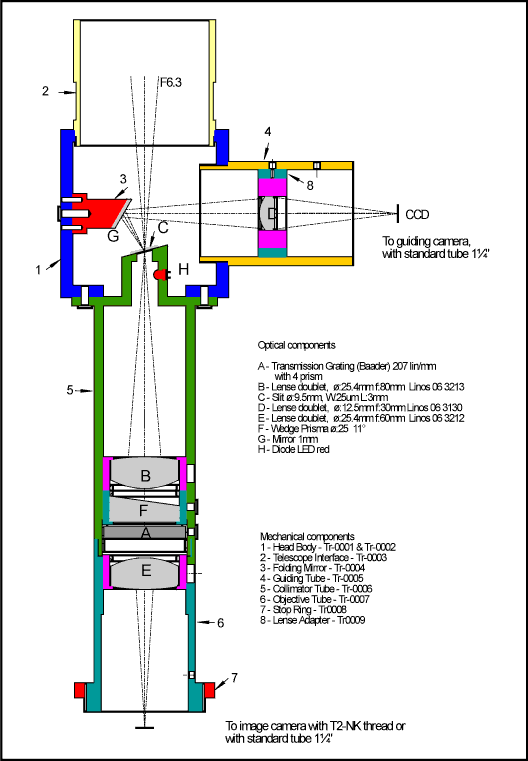
The Shelyak instrument probably most similar in concept to the lowspec is the LISA, which is also a classical spectrograph design, though the better LISA optics give better performance at the UV/IR ends and allow it to be used on larger aperture faster telescopes. The lowspec is more versatile as you can change the grating to alter the resolution.
The LHIRES is a Littrow design in which the light passes through the same lens on the way to and from the grating. This was originally an open source design by Christian Buil and others and was sold as a not for profit kit by the design team. (Mine is one of these) The Shelyak company was then set up to offer it commercially. You can still find all the drawings etc here but it is not really practical to build one yourself as a one off, though some people have.
http://www.astrosurf.com/thizy/lhires3/index-en.html
Cheers
Robin
-
Hi Louise,
You can see Paul Gerlach's complete thread describing the development of the instrument from the original idea to the current design here on the VdS forum. It evolved significantly over 3 years
https://forum.vdsastro.de/viewtopic.php?f=28&t=4432
Cheers
Robin
-
I can now reveal Star B is 2MASS J19095965+0437597, a previously unknown variable, co-discovered with Adam Nowak
https://www.aavso.org/vsx/index.php?view=detail.top&oid=1498835
Note the brightness of this star at ~mag 19 g which would make it by far the faintest object recorded spectroscopically using amateur equipment. This is a bit of a cheat though as my spectrum mainly covers the R and I bands where the star is significantly brighter (This is an M6 star, further reddened significantly by the interstellar medium, which explains its presence in the 2MASS catalogue of objects detectable in the IR at 2 microns.
Cheers
Robin
-
3
-
-
1 minute ago, Thalestris24 said:
Perhaps a beam splitter could be a workaround, accepting a loss of transmitted light. Oh well.
Louise
That has been tried eg Ken's original L200 design. The problem is not so much the transmission, (You can use ordinary glass and just reflect 10% to the guider or use a hot mirror and guide on the unused IR) The main problem is keeping it all aligned so you know where the slit is and that you are in focus at the slit. The Starlight Xpress spectrograph uses one but I have never seen any results from this spectrograph. I dont think the OVIO slit is horrendously expensive. It is used in the lowspec for example
-
13 minutes ago, robin_astro said:
and what the image typically looks like for my ALPY spectrograph
This shows the star I recorded a spectrum of and the guide star I used. (The target is focused and moved onto the slit (black line), where it disappears as almost all the light passes though the slit into the spectrograph. It is then kept on the slit using the guide star (PHD guiding program)

-
1
-
-
The mirror slit guider uses a mirror with the spectrograph slit in it where the reflective surface has been removed. The field is viewed with a separate guide camera. This allows the star field to be viewed, the star of interest brought to focus and moved onto the slit and kept there. Without it you are working completely blind. This is an example of a typical optical configuration (The tragos spectrogaph) though all commerical amateur slit spectrographs have something similar.
and what the image typically looks like for my ALPY spectrograph
-
1 minute ago, Thalestris24 said:
Ta for the info, Robin! I think this astro spectroscopy has given me bipolar disorder - I'm blowing hot and cold over it! Can I ask why the system would be unusable without the guiding module? Wouldn't a standard oag work instead - or even a normal guider? I'd still only be doing brighter stars - if I actually do get around to it...
Louise
With a slit spectrogaph is is really tough and frustrating even on bright targets. There are techniques which make it just possible but to be honest the mirror slit guider revolutionised astronomical spectroscopy as it allows you not only to guide but also find the target and put it on the slit in the first place and focus it when it is there
Cheers
Robin
-
1
-
-
The problem with Czerny-Turner and similar designs for stellar spectroscopy is the inherent astigmatism which they produce. (OK for a lab bench instrument but a problem for stars as you dilute the spectrum against the background.) Christian's clever precisely tuned optical configuration tames this to some extent and what remains is largely eliminated by the cylindrical lens. (Note any slit spectrogrph is effectively unuseable without a guiding module, the 3D printed design of which has not yet been released forthe UVEX so you would need the ALPY guide unit.)
Classical designs like the Lowspec are much more forgiving to build to give good performance and the lowspec design is complete including guiding module. It does not give as wide coverage without chromatism problems which defocuses the spectrum at the extreme ends but from what I have seen, the lowspec works fine though with reasonably slow telescope optics over the usual range ~3800-7000A. (There is an example currently on ken's astronomical spectroscopy yahoo group)
With a slit design, atmospheric turbulance does not affect the spectrum though it does reduce throughput.
Chromatism in the telescope optics with slitless systems degrades resolution, but with slit spectrographs there is no loss of resolution. Good instrument response correction can be more difficult though due the selective sampling of the wavelength range at the slit. This is generally reasonably manageable though provided the focus does not shift between reference and target measurements.
Cheers
Robin
-
18 hours ago, Merlin66 said:
ISIS is great but is definitely focused on support for the Shelyak product range.....
Hi Ken,
Shelyak have their own software (Demetra) that they are developing for their instruments (currently only for the ALPY, I believe)
Concerning ISIS, this predates the formation of Shelyak as a company. It is no secret that as arguably the world leading amateur spectroscopist, Christian Buil develops ISIS primarily for his own use so it true that it has features that make it extremely efficient when processing spectra from the spectrographs that were designed by him but it has all the tools to reduce the spectra from any spectrograph. As an example here are the various options for wavelength calibration ranging from fully manual line selection through to a one click automated system based on either a built in or a user generated custom file of calibration lines for any specific spectrograph and camera combination
http://www.astrosurf.com/buil/isis/tutorial/calibration_us.htm
-
1
-
-
32 minutes ago, andrew s said:
Looking much more like it. I am slightly puzzled as to why your zero order is not at zero.
What order fit are you using? As Robin points out it should be close to linear so I would use a linear fit or a 2nd order at most.
Yes it is very important that the calibration passes through zero at the zero order otherwise you cannot use it to calibrate other stars where the wavelength of the lines will not generally be known. This may be at the expense of precise alignment of other lines but this is less important
Cheers
Robin
-
2
-
 1
1
-
-
Hi Nigella,
The calibration of the Star Analyser is very close to linear so to start with you can use just the zero order and one other line eg H beta which are easy to identify. If you first calibrate using these two lines and then overlay the Hydrogen lines it becomes obvious which features approximately line up with the other lines and you can then add these to the calibration if you like. (In practise I dont usually bother recalibrating using a non linear calibration and just use a linear calibration as wavelength calibration of slitless spectra is only approximate anyway)
Once you have this calibration, you can use this and the zero order to wavelength calibrate any spectra using just the zero order.
Cheers
Robin
-
1
-
-
I use ISIS for all my Pro-Am work as I would say do the majority of amateurs doing research grade spectroscopy but it is not so easy for a beginner, particularly with the Star Analyser. Another freeware alternative is Visual Spec which I "grew up with" though it is prone to crash.
-
1
-
-
16 minutes ago, Stu Todd said:
You may need the guiding and calibration module on top of that which bumps the price up - https://www.shelyak.com/categorie-produit/debuter-en/alpy-en/?lang=en
I'd look at 3D printing a UVEX, I think the optics come in at 400 quid or so, looks to be an excellent spectragraph too.
Yep the ALPY guiding module is a must but the calibration module is a nice to have. The spectrograph is very stable so you can calibrate using known lines in a reference star, even the sun using the daylight sky and halogen lamp waved in front of the telescope is good enough for a spectroscopic flat.
More on the development of the UVEX here.
http://www.spectro-aras.com/forum/viewforum.php?f=45
Deigned by world leading amateur spectroscopist Christian Buil, it was principally designed to extend the range of amateurs spectroscopy into the UV but the the performance has proved to be impressive across the full visible spectrum. It is not quite fully developed yet (I think it is awaiting finalisation of the guider/calibration module, otherwise you need to use the one from the ALPY) and alignment is critical and tricky. I can see this being a commercially produced instrument at some stage though. The lowspec is a very conventional design and might be more straightforward for someone new to spectroscopy.
https://www.thingiverse.com/thing:2455390
Cheers
Robin
-
4
-
-
1 minute ago, Thalestris24 said:
Still a lot of money! At least, for a poor person like me.
Sadly yes. Perhaps the downside of getting addicted through the Star Analyser is how it can lead to cravings for the harder stuff 😞
-
1 minute ago, Thalestris24 said:
They are over £3k!
Louise
Yes but Gav asked what would be needed for detailed spectral classification. You can do a lot of other interesting stuff with a Star Analyser and plenty of real science with a cheaper ALPY 600 core plus guider module for example
Cheers
Robin
-
1
-
-
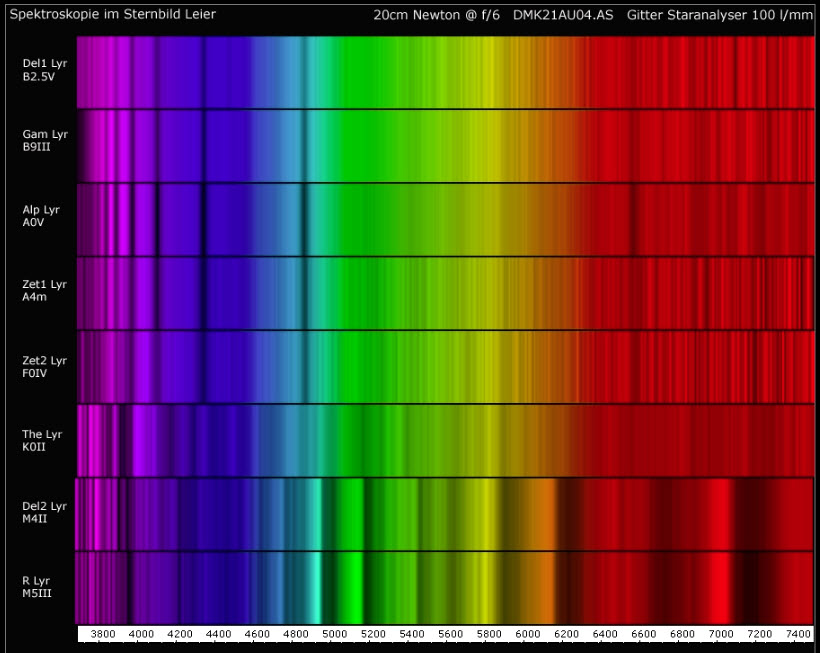
But if all you need is a general impression of how the spectrum changes with temperature then the Star Analyser can do this as Torsten Hansen showed here
-
1
-
-
If you are into self build then there are a couple of 3D printed designs (lowspec and Uvex) which potentially have enough resolution get you into this area
UVEX in particular would make a very nice spectral classification instrument because of its good UV end capability
http://www.astrosurf.com/buil/UVEX_project_us/
Robin
-
7 minutes ago, PhotoGav said:
Thank you again Robin. I’ll hunt down your post.
What level of kit beyond the Star Analyser would be needed for a resolution suitable to get somewhere with this?
Something like a LISA spectrograph with a resolving power of 1000. To be honest though other than identifying cataclysmic variables (novae, supernovae etc) from their spectra precise spectral classification is a specialist area which needs quite a bit of skill and knowledge and is not an area amateur spectroscopists generally get into really. If you are looking for an up to date book on the subject a good reference is
Gray and Corbally "Stellar Spectral Classification"
Stars who's spectra vary are more interesting. For example there have been some recent posts on the AAVSO forum tracking the dwarf nova SS Cyg through its cycle every 2 months where the changes both in temperature and emission lines are clearly seen at Star Analyser resolution
Cheers
Robin
-
1
-
-
Hi Gav,
It is not so much the brightness but the ability to resolve the key lines that determine the spectral type. This can be done approximately for types where the features are clear eg A and M but not in general for intermediate types F-K . The resolution of the Star Analyser is also insufficient to determine the luminosity class. The difficulties typically encountered can be seen in the post "A tale of two stars" where I discuss an attempt to classify two newly discovered variable stars using spectra at Star Analyser resolution.
BTW if you are interested in a particular star's classification Brian Skiffs huge database of published classifications is a good resource
http://vizier.u-strasbg.fr/viz-bin/VizieR?-source=B/mk
A quick browse of that will indicate in practise what an inexact science spectral classification is !
Cheers
Robin
-
To answer a question raised in another post about the possibility of using the Star Analyser to do spectral classification, here is an example of a couple of stars I attempted to classify using spectra at the same resolution as a typical Star Analyser spectrum (~45A). It is rather long so I have put it in a pdf but the executive summary is
"Spectral classification is based on what spectral lines are present and at what strength, not the shape of the spectrum continuum and this needs sufficient resolution to resolve these lines (Typically 10A or better). Spectra at typical Star Analyser resolution can contain clues as to the approximate spectral type but in general they are not good enoigh for precise spectral classification. The discovery in the early 20th century that the lines in the spectrum could be used to measure the temperature of a star and its size revolutionised stellar astrophysics"
Cheers
Robin
-
6
-
-
20 hours ago, PhotoGav said:
I am investigating the whole area of spectroscopy on a budget... how ‘easy’ is it to establish a star’s spectral type by using a Star Analyser? Would I get any usable results or is this a step too far for the humble amateur astronomer?
OK time for reality check here I am afraid. The key point to understand is that spectral classification uses the presence or absence of particular lines, not the shape of the spectrum continuum. The reason is that using the shape of the spectrum continuum can be totally misleading due to interstellar extinction. (If this could be used it would be easier just to use the colour (UBVRI) photmetry. I will post an extreme example of this for a star I am currently studying, later today when I have reduced it.
Detailed spectral classification is not the Star Analyser's strength I am afraid because the resolution is not high enough (You really need a resolution of 5-10A or better to resolve the lines sufficiently) You can get a rough idea (ie hot stars show H and He lines, cool stars show molecular bands but the spectra in between tend to be a mush of overlapping lines which are difficult to distinguish.)
For me the Star Analyser strength is looking at the more unusual objects with bold features in their spectra. These are much more interesting astrophysically in any case. (eg exploding stars, stars with hot discs around them or with intense stellar winds, planetary nebulae, methane in planet atmospheres, distant quasars and active galaxies
Cheers
Robin
-
2
-


Camera response from spectra and calibration
in Radio Astronomy and Spectroscopy
Posted
And here is an example specifically for a colour camera using a Star Analyser
http://www.threehillsobservatory.co.uk/astro/spectroscopy_11a.htm
Cheers
Robin